
There’s no shortage of articles about the challenges facing the journalism industry. To better understand current practices and interest in future research, we fielded a survey of news editors and directors. We gathered a list of approximately 11,000 editors and news directors from Easy Media List and sent several emails and a postcard inviting them to take part in the survey. In exchange, we sent participants an early report of the results tailored to their organization. In total, 525 completed the survey. We note that the resulting data are not representative of the news media at large; rather, the data represent the subset willing to fill out a short survey. The characteristics of those completing the survey can be found in the Methodology section at the close of this report.
Key Findings
We asked those completing the survey whether their newsroom was most focused on a newspaper (58%), radio (13%), television (11%), or web (15%) product.1 We present our results both overall and by medium. Several findings stand out:
- Newspaper-focused newsrooms are comparatively less likely to use research and development strategies (i.e., monitor digital metrics, partner with researchers and use A/B testing) than television and website-focused organizations.
- Television-focused organizations are more likely to have a mobile-friendly website than newspaper-focused newsrooms.
- Although it’s common for newsrooms to respond to their audience in the comment sections on Facebook or Twitter, less than a third have a written policy about how to moderate comment sections.
- 91% of newspaper-focused and 95% of television-focused newsrooms ask audiences to submit pictures or videos.
- Television-focused (67%) and website-focused (51%) newsrooms are more likely to employ individuals to promote audience engagement than newspaper-focused (32%) organizations.
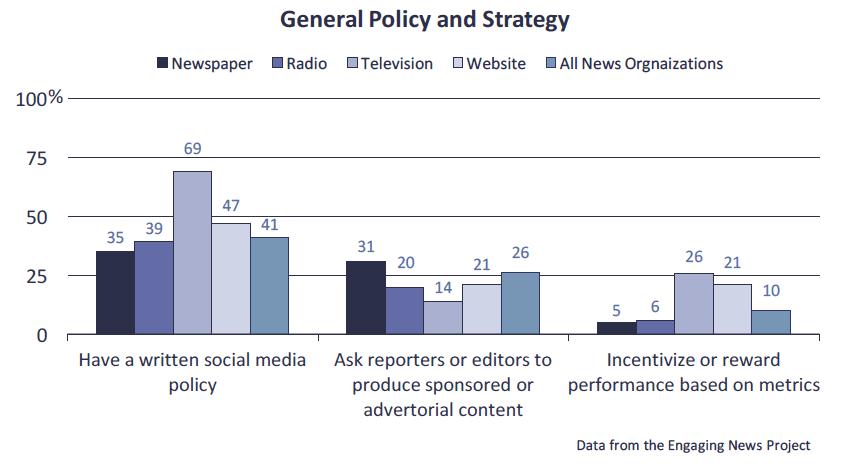
- Incentivizing or rewarding performance based on metrics is rare; only 5% of newspaper-focused and 6% of radio-focused organizations do so.
- Most organizations self-grade their overall news coverage as a B.
- 78% of respondents say their newsrooms prioritize providing information about important public matters over profit, rather than the other way around.
- Newsrooms are most interested in learning more about engaging audiences and least interested in designing mobile apps.
- When asked about the most important problems facing journalism today, the most common responses were financial sustainability (e.g., monetizing content, generating revenue, etc., mentioned by 29% of respondents) and a lack of credibility and quality (e.g., bias reporting, loss of integrity, poor quality content, etc., mentioned by 29% of respondents).
Implications for Newsrooms
The news organizations responding to this survey expressed concern about the state of journalism, particularly related to revenue, credibility, and the quality of news. Despite the concern about journalism’s business model, most agreed that the news media should cover important public matters even if it means sacrificing profits.
We asked news organizations about whether or not they engaged in a wide variety of practices. The two most prevalent were monitoring digital metrics (87% of survey respondents) and responding to audience members in comment sections, on Facebook, or on Twitter (87%). Least common were incentivizing or rewarding performance based on metrics (10%) and the use of A/B testing (10%). We note, however, that many respondents indicated that they were not aware whether their organization was doing A/B testing.
For several of these practices, we think that there’s a lost opportunity. For A/B testing in particular, the use of this practice can help to inform newsroom practices based on audience preferences. We also note that only 20% of news organizations had partnered with researchers to test new strategies for audience engagement. Both of these could be increased, we believe, to good ends.
This survey is only a snapshot and the respondents are not representative of the broader journalism industry. With that said, the results provide some insight into the practices at some news organizations and how these differ depending on the newsroom type.
The Study
Many Newsrooms Monitor Analytics; A/B Testing Less Common
The research and development strategies newsrooms currently use vary. Monitoring digital metrics (e.g. page views, unique visitors, etc.) is the most frequently used research strategy among all news media combined (87%). Partnering with researchers to test new strategies for audience engagement (20%) and using A/B testing (10%) are less frequently employed. For the use of A/B testing, 41% of respondents do not know whether their newsroom employs the practice and 48% report that their newsroom does not.
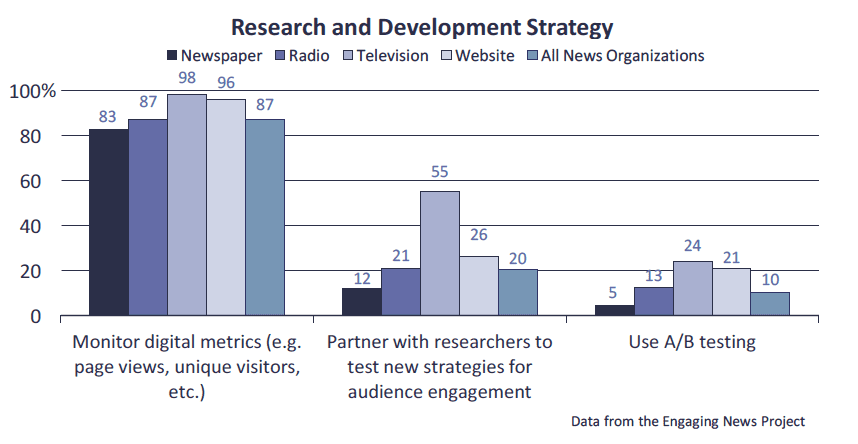
Monitoring digital metrics significantly differs between newspapers and other media. Newspaper- focused organizations included in this study are less likely to monitor digital metrics (83%) in comparison to television-focused (98%) and website-focused (96%) newsrooms.2
Similarly, there are differences by organization type in terms of whether a newsroom partners with researchers to test new strategies for audience engagement. Newspapers are less likely to partner (12%) than television (55%) and website (26%) focused organizations. Furthermore, television-focused organizations are more likely to partner with researchers (55%) than all other newsrooms.3
The use of A/B testing is the least frequently mentioned strategy, although many are unsure of whether their newsroom engages in the practice. Newspaper-focused organizations are comparatively less likely to say that they use A/B testing (5%) than television-focused (24%) and website-focused (21%) newsrooms.4
Mobile-Friendly Websites & Mobile-Tailored Content are More Common in Television-Focused Newsrooms
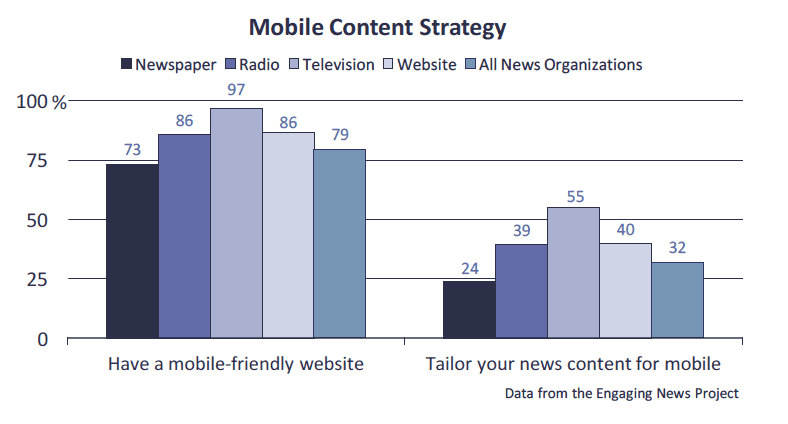
With respect to mobile content and strategy, most newsrooms have a mobile-friendly website. According to the data, 79% of all newsrooms combined have a mobile-friendly website. Television- focused newsrooms are more likely to have a mobile-friendly website (97%) than newspaper-focused organizations (73%).5
Across all news media, 32% tailor their news content for mobile. Newspaper-focused organizations (24%) are less likely to tailor their content for mobile than other newsrooms.6
Responding in the Comment Sections is Frequently Practiced, But Having a Policy on How to Moderate Comment Sections is Rare
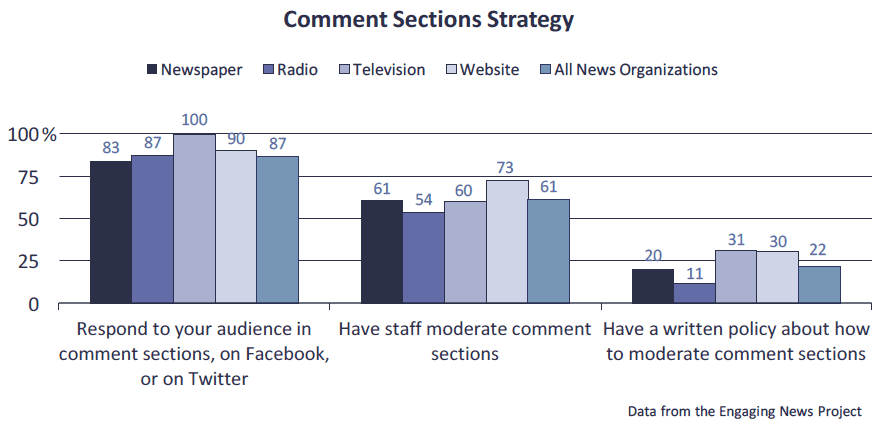
The use of comment section strategies varies across organizations. Responding to audiences in the comment sections, on Facebook, or on Twitter is the most frequently used strategy (87%). This practice is used by all television-focused news organizations responding to the survey and nearly all website- focused (90%) newsrooms. Television-focused organizations are comparatively more likely to respond to their audiences in these social spaces than radio-focused (87%) and newspaper-focused (83%) organizations.7
Among all news organizations, 61% have staff moderate their comment sections. The prevalence of the practice does not statistically differ by medium.8
Having a written policy about how to moderate comment sections is least frequently used by all mediums. Further, radio-focused newsrooms are significantly less likely (11%) than television-focused (31%) and website-focused (30%) newsrooms to have a written policy about how to moderate comment sections.9
Newspapers are More Likely to Ask Audiences to Submit Content, But Less Likely to Use Other Engagement Strategies
Some news organizations ask their audience to submit pictures or videos, and use news quizzes or other interactive tools. However, the practice is not consistent or common across all newsrooms.
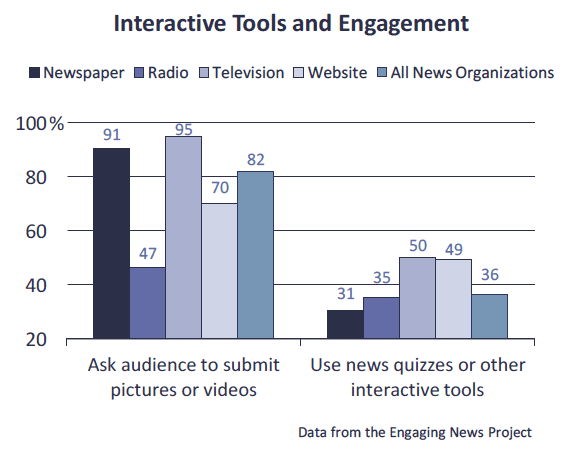
Asking audiences to submit pictures or video is the most frequently used engagement strategy among newsrooms. Newspaper-focused (91%) and television-focused organizations (95%) are more likely to ask their audience to submit pictures or videos than website-focused organizations (70%), which are more likely than radio-focused newsrooms (47%).10
Quizzes or other interactive tools are less frequently used by newsrooms. Newspaper-focused organizations are less likely to use interactive tools (31%) than television-focused (50%) and website-focused (49%) newsrooms.11
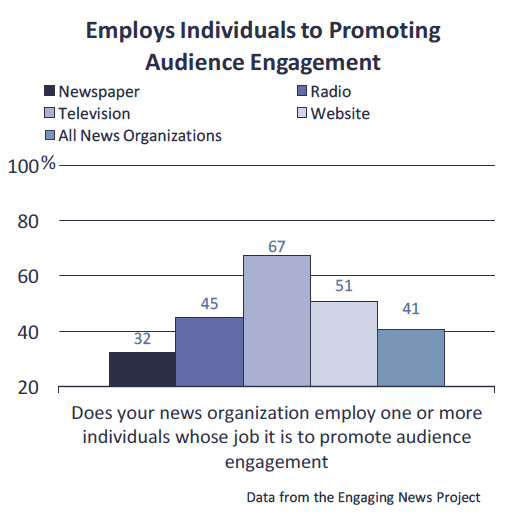
Although some organizations employ individuals to promote audience engagement, this practice is not prevalent in all newsrooms. Newspaper- focused organizations (32%) are significantly less likely to employ individuals to promote audience engagement than television-focused (67%) and website-focused (51%) news organizations.12
As for the job title of employees promoting audience engagement, 21% are referred to as digital audience development directors, 14% are engagement editors, 11% are community editors, 9% are audience and engagement editors and 7% are community managers. However, other job titles make up 55% of responses, indicating that most employees have a title other than those listed above. When specified by survey participants, this category included titles such as social media editor, digital producer, or online coordinator.
Having a Written Social Media Policy, Producing Sponsored Content & Awarding Performance Based on Metrics Vary Across Newsrooms
Overall, 41% of news organizations completing our survey have a written social media policy. Television-based news organizations (69%) are more likely than newspaper-focused (35%) and radio-focused newsrooms (39%) to have a written social media policy.13
Less frequently practiced is asking reporters or editors to produce sponsored or advertorial content, which took place at 26% of the news organizations surveyed. Newspaper-focused organizations are more likely to do so (31%) than television-focused newsrooms (14%).14
Overall, only 10% of all newsrooms surveyed incentivize or reward performance based on metrics. Of these organizations, television-focused (26%) and website-focused (21%) newsrooms are more likely to do so than newspaper-focused (5%) or radio-focused (6%) organizations.15
Most Newsrooms Grade Overall Coverage “B” & Prioritize Coverage Over Profit
Newsrooms most frequently grade their news coverage as a B. This includes 65% of newspaper-focused organizations, 61% of website-based newsrooms, 59% of television-focused newsrooms, and 51% of radio-focused newsrooms. There are no significant differences between the type of news organization and how newsrooms self-evaluate their coverage.16

Similarly, when asked about prioritizing profit or public affairs, there are no significant differences across organizations. Overall, 21% of the news organizations completing the survey said that “It is important for the news organization to be profitable, even if that means covering less news about public affairs.” The other 78% agreed more with the statement that “It is important for the news organization to provide information about important public matters, even if that means sacrificing some profits.”
Newsrooms Are Most Interested in Engaging Audiences
All survey respondents were asked to indicate how interested or uninterested their newsrooms would be in learning more about designing mobile apps, engaging audiences on mobile, designing mobile websites, comment sections, engaging audiences on social media, homepage design and article design.
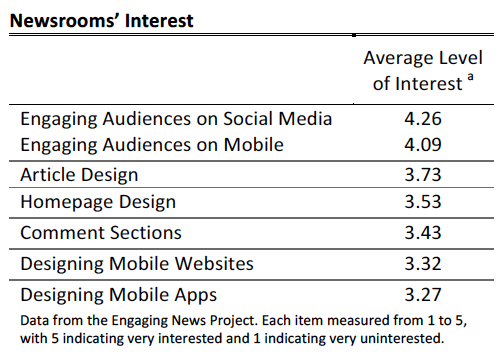
On average, respondents showed the most interest in learning more about engaging audiences on social media and on mobile. In contrast, news organizations indicate the least amount of interest in learning about designing mobile apps.
Revenue, Credibility, and Quality are Most Important Problems Facing Journalism
When asked what the most important problem facing journalism today is, responses fell into a number of categories, as seen in the chart below. Responses could fall into multiple categories.
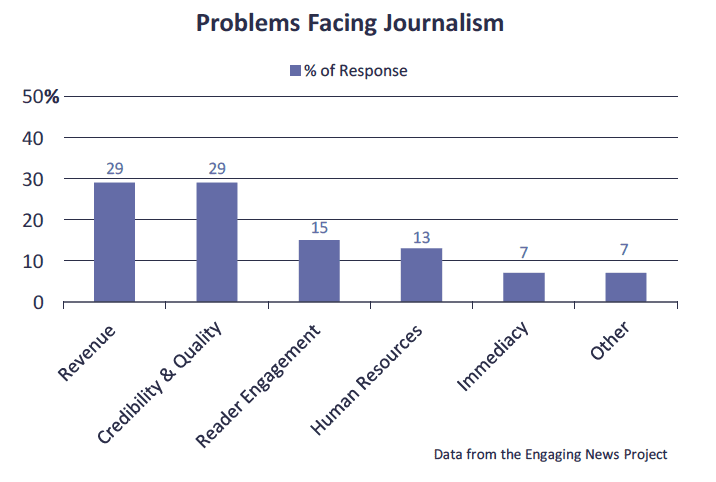
Revenue. Problems related to generating revenue account for 29% of responses. This includes a lack of resources, loss of advertising dollars, lack of a sustainable business model, as well as the inability to effectively monetize online content, as seen in the following response:
“How to pay for it [journalism]. People want it and depend upon it, but our old ‘sell ads to fund newsrooms’ formula does not seem to work too well these days.”
Credibility & Quality. Similarly, 29% of responses refer to problems related to credibility and quality. This includes poor quality content, biased reporting, and a loss of the integrity associated with professional journalism. Other related problems include misinformation online and social media seen as a valid source of news. Some examples of credibility, accuracy, and quality are seen in the responses below.
“Merging commentary with reporting. There seems to be an awful lot of opinion getting in the way of just telling the facts. Too many outlets use ‘freedom of speech’ as an excuse to give full reign to their personal bias. This creates distrust toward the media in the public.”
“Social media is definitely injurious to credentialed media today. I personally have to discern what comes across my desk to know what is real and what is not real. Social media has no restrictions on what it produces. No facts, no resourcing, no credibility. Also, the talking heads on television, whether liberal or conservative, pass themselves off as journalists whereas they are not even remotely related to journalism. They are entertainment, not news.”
“Unbalanced and biased news coverage causing a severe lack of distrust in the media by the general public.”
Engagement. Problems related to engagement and reader’s attention made up 15% of responses. This includes an inability to engage with readers and their communities, connect with readers’ interests, and retain readership. Respondents also mentioned readers’ short attention spans. Some of these concepts are reflected in the responses below.
“Reporters and editors out of touch with the social and political values of their communities.”
“Producing content that attracts the desired audience. People have many options for news and many other distractions.”
Human Resources. The lack of human resources and a downsizing of the industry includes 13% of the responses. Among this category are responses that reference low wages for journalists, staff cutbacks, and the downsizing of the newsroom. Similarly, poor training of journalists and a lack of qualified job applicants are also of concern. One example of human resources as it relates to low wages is expressed in the following response:
“Competitive pay that keeps talented journalists in the field. We’ve lost too many great, experienced reporters to entry-level PR jobs because the paycheck was bigger.”
Immediacy. Seven percent of responses discussed problems related to immediacy. This includes the pressure to meet the public’s demand for immediate news and the non-stop, 24/7 news cycle. This sentiment is demonstrated in the response below.
“Finding ways to remain the ‘go-to source’ in the community. With the rush of citizen journalism through social media, people want immediate coverage. Unfortunately, that craving for immediacy can overwhelm staff as it must not only report news, but also quell runaway Facebook rumor on a subject.”
Other. Other problems mentioned made up 7% of responses and include corporate ownership, using digital tools effectively, and competition with countless sources online.
Methodology
Sampling and Newsrooms Attributes
In this study, we examined responses from 552 newsrooms across the United States. Participants were chosen based on news editor media contact lists for all 50 U.S. states and Washington D.C. from Easy Media List, a service of Mondo Code LLC.17 The media lists contained a total of 11,326 news organization contacts.
We sent our first email request to participate in waves through the service Constant Contact between September 15 and October 5, 2015. We sent follow-up emails between October 6 and October 8, 2015. We sent a final email on November 12. We also reached out to news organizations through postcards. In early November of 2015, we mailed out a University of Texas at Austin and Center for Media Engagement- branded postcard to 8,974 newsrooms.
In early 2016, as a final attempt to promote the survey and increase participation, we called 86 broadcast newsrooms and 58 newspapers in the largest media markets. We contacted these organizations directly using phone numbers supplied on our media list as well as the phone numbers provided on the organizations’ websites. A week after beginning calls, a final follow-up call was made to organizations we were unable to reach during initial calls. Participants were allowed to pass the survey along to another newsroom staff member. Once participants were contacted, the survey was distributed via email. The survey took approximately 10 minutes to complete, and respondents were offered a tailored report in exchange for their participation.
Of the participants surveyed, 79.4% were editors or directors, 3.3% were reporters or journalists, 1.6% were producers, and 0.6% were designers. Other job titles made up 15.1% of the participants and included publishers, managers, owners, and executives.
Respondents were asked to indicate the ways in which their newsroom distributes content and were able to select multiple categories. Of the 552 respondents, 68% indicated newspaper (print), 17% television news, 22% radio, 95% website, 47% mobile app, 94% Facebook, 78% Twitter, and 36% Instagram. For each category checked, we asked a follow-up question about the audience size. (See full chart in full report).18
We asked respondents to indicate which medium was their highest priority in terms of time and energy spent producing content. Based on what respondents reported, 315 newsrooms included were newspaper focused, 71 radio focused, 58 television focused, and 81 website focused. Other organizations besides those listed above (27) were excluded from the final analysis. We used this variable for the analyses presented throughout this report.
The Most Important Problem in Journalism Today
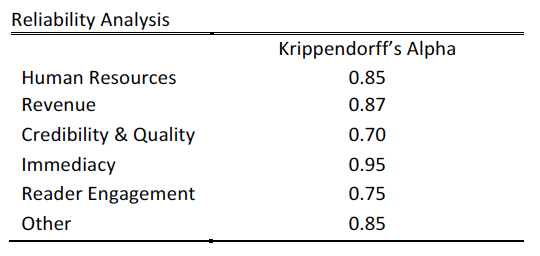
All respondents were asked, “What do you feel is the most important problem in journalism today?” Two researchers coded for each response participants gave. Responses could be coded into multiple categories. In order to establish consistency between coders, we coded a minimum of 20 percent of responses until each code achieved acceptable reliability. We used Krippendorff’s alpha as a measure of reliability, where scores at or above 0.70 are considered acceptable.
SUGGESTED CITATION:
Stroud, Natalie Jomini, Alizor, Alexis, and Lang, Cameron. (2016, August). Survey of news editors and directors. Center for Media Engagement. https://mediaengagement.org/research/survey-of-news-editors-and-directors
- We don’t include the 2% of responses focused on other mediums or not identifying the medium on which they focus most. [↩]
- 2.7% indicated that they did not know whether their newsroom monitored digital metrics. Because so few respondents said that they did not know, we compare those who answered yes to those who said either no or don’t know. There was a significant difference by medium-focus, χ2 (3, N=524) = 17.84, p < .001 [↩]
- 9.7% indicated that they did not know whether their newsroom partnered with researchers. As the sample size allowed for it, we compared those who said yes to those who said no to those who said they were not sure. There was a significant difference by medium-focus, χ2 (6, N=524) = 57.52, p < .001 [↩]
- 41.3% indicated that they did not know whether their newsroom used A/B testing. As the sample size allowed for it, we compared those who said yes to those who said no to those who said they were not sure. There was a significant difference by medium-focus, χ2 (6, N=523) = 36.14, p < .001 [↩]
- 3.6% indicated that they did not know whether they had a mobile-friendly website. Because so few respondents said that they did not know, we compare those who answered yes to those who said either no or don’t know. There was a significant difference by medium-focus, χ2 (3, N=524) = 22.74, p < .001 [↩]
- 3.2% indicated that they did not know whether they tailored their content for mobile. Because so few respondents said that they did not know, we compare those who answered yes to those who said either no or don’t know. There was a significant difference by medium-focus, χ2 (3, N=524) = 28.24, p < .001 [↩]
- 1.0% indicated that they did not know whether they respond to their audience on social platforms. Because so few respondents said that they did not know, we compare those who answered yes to those who said either no or don’t know. There was a significant difference by medium-focus, χ2 (3, N=524) = 12.74, p < .01 [↩]
- 3.6% indicated that they did not know whether their staff moderate comment sections. Because so few respondents said that they did not know, we compare those who answered yes to those who said either no or don’t know. There was not a significant difference by medium-focus, χ2 (3, N=523) = 6.15, p = .10, n.s. [↩]
- 7.9% indicated that they did not know whether they had a written policy for moderating comment sections. Because so few respondents said that they did not know, we compare those who answered yes to those who said either no or don’t know. There was a significant difference by medium-focus, χ2 (3, N=522) = 11.81, p < .01 [↩]
- 0.2% indicated that they did not know whether they had a written policy for moderating comment sections. Because so few respondents said that they did not know, we compare those who answered yes to those who said either no or don’t know. There was a significant difference by medium-focus, χ2 (3, N=524) = 89.79, p < .001 [↩]
- 2.3% indicated that they did not know whether they had a written policy for moderating comment sections. Because so few respondents said that they did not know, we compare those who answered yes to those who said either no or don’t know. There was a significant difference by medium-focus, χ2 (3, N=524) = 15.20, p < .01 [↩]
- 4.6% indicated that they did not know whether they employed anyone to promote audience engagement. Because so few respondents said that they did not know, we compare those who answered yes to those who said either no or don’t know. There was a significant difference by medium-focus, χ2 (3, N=525) =30.55, p < .001 [↩]
- 6.3% indicated that they did not know whether they had a written social media policy. Because so few respondents said that they did not know, we compare those who answered yes to those who said either no or don’t know. There was a significant difference by medium-focus, χ2 (3, N=524) =24.57, p < .001 [↩]
- 2.1% indicated that they did not know whether the newsroom asked reporters or editors to produce sponsored or advertorial content. Because so few respondents said that they did not know, we compare those who answered yes to those who said either no or don’t know. There was a significant difference by medium-focus, χ2 (3, N=524) =10.92, p < .05 [↩]
- 6.3% indicated that they did not know whether they incentivized or rewarded performance based on metrics. Because so few respondents said that they did not know, we compare those who answered yes to those who said either no or don’t know. There was a significant difference by medium-focus, χ2 (3, N=523) =38.84, p < .001 [↩]
- There was not a significant difference between variables, χ2 (6, N=524) =10.77, p= 0.10, n.s. [↩]
- Easy Media List: http://www.easymedialist.com/ [↩]
- The question asked about “weekly circulation” as some of the newspapers we contacted were not dailies. [↩]