


The Solutions Journalism Network is an organization dedicated to understanding and promoting news coverage of responses to pressing social problems. In addition to reporting on the problems facing communities, solutions journalism involves a critical examination of possible ways to solve these issues. Much remains to be learned about how this form of journalism functions. The following studies were designed to understand how audiences engage with solutions-oriented headlines. These studies were jointly funded by the Solutions Journalism Network and the Center for Media Engagement, thanks to grants from the Democracy Fund, Hewlett Foundation, and Rita Allen Foundation.
To do this work, we partnered with The Huffington Post to test 50 pairs of headlines. For each test, The Huffington Post randomized whether visitors to its homepage saw a non-solutions-focused headline or a solutions-focused headline. Both headlines linked to the same article that included information about a problem and a possible solution. After between three and nine hours had passed, The Huffington Post then recorded how many clicks there were on each headline version.
We also conducted a survey-based experiment with 1,034 U.S. adults. In this study, participants were shown a list of headlines and asked to indicate which corresponding story they would most like to read. Each list of headlines contained a solution headline and three unrelated headlines. We experimentally varied the attributes of the solution headline. This study allowed us to analyze what attributes of solutions headlines heighten or diminish user interest.
Key Findings
The following results stand out:
- On balance, solutions headlines yield more clicks than non-solutions headlines – but the difference is modest and many other factors also affect the number of clicks received by each headline. Across the 50 Huffington Post tests, the solutions headline garnered more page views 56% of the time, the non-solutions headline attracted more clicks 40% of the time, and the two tied 4% of the time.
- We then used an experiment to examine four hypotheses about writing solutions These tests yielded few easy conclusions:
- Including a “mysterious” unnamed location or group in a headline can increase the click-through rate (e.g. “This City Has a Solution to Poverty”).
- Adding the word “simple” can affect headline clicks, but does not do so consistently (e.g. “A Simple Way to Address Climate Change”).
- Tacking solutions-oriented information or an action item onto a headline does not significantly affect the click-through rate (e.g. “This is a Problem. Here’s How to Help”).
- Adding the word “you” does not significantly influence the click-through rate (e.g. “Here’s How You Can Help Save the Rainforests”).
Implications for Newsrooms
The 50 A/B tests conducted by The Huffington Post demonstrate that solutions headlines do not always outperform non-solutions headlines. Looking across all of the tests, however, solutions headlines do tend to modestly boost clicks.
Looking more deeply at the attributes of headlines that can increase or decrease performance, we tested four different hypotheses. Evidence suggested that solutions headlines containing a “mysterious” unnamed location or group can increase engagement.
Results were mixed when it came to adding “simple” or “you” to a headline. The Huffington Post tests suggested that “simple” could increase engagement, but the experimental manipulation showed that adding “simple” was detrimental or neutral when it came to clicks. “You” produced mixed results in The Huffington Post tests, and we observed no differences in selection in our experiment. One explanation for the varied findings could be that words such as “simple” and “you” may have a topic-dependent impact on clicks. In any case, the differences observed in our study of the word “simple” demonstrate how changing one word can affect how users engage with news content, albeit inconsistently.
Finally, tacking information on to a solutions headline did not have a noticeable impact on clicks. Whether the information was presented in one sentence, or as an additional clause tacked on to the end of a headline, there was no considerable difference in people’s headline preferences.
Taken together, these results provide some justification for using solutions-based headlines. The findings also provide a starting point for analyzing which headlines yield greater audience engagement via clicks.
The Study
Solutions Headlines Garner More Clicks Than Non-Solutions Headlines, But Not in Every Case
Across 50 A/B tests on The Huffington Post site, the solutions headline garnered more clicks in 28 tests (56% of the tests), the non-solutions version 20 times (40%), and the two tied in two instances (4%). The actual number of clicks, however, varied widely – from 0 to 10,560 per headline.
By treating the results of each of the 50 tests as an observation, we underestimate the true number of observations. The true number of observations is the total number of people viewing one of the two headlines. For this reason, we ran several additional analyses to examine whether solutions headlines outperformed the non-solutions headlines.1 The results of the tests confirmed that, in general, people are more likely to click on a solutions-oriented headline than they are on a non-solutions-focused one. The increase in the click-through rate, however, is modest.2
Including a “Mysterious” Location or Group May Increase Clicks
In several instances, we saw The Huffington Post use an unnamed location, person, or group in a headline. For example, the headline would say “One City’s Solution to the Drought.” Here, the city is ambiguous and requires a reader to click on the headline to discover the identity of the unnamed location. The results of our analyses suggest that using this strategy in a solutions headline can be beneficial in some instances.
Huffington Post Headline Tests
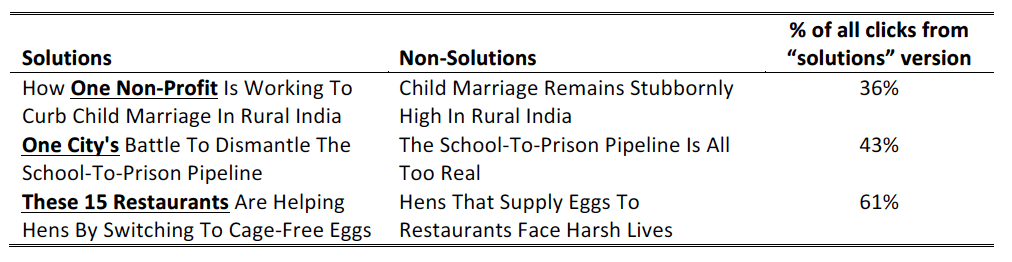
There was variability in the success of using a “mysterious” entity in The Huffington Post headline tests (examples are included in the table below). In some cases, a solutions version with a mysterious entity yielded a higher click-through rate than a non-solutions version without a mysterious entity. In other cases, however, the non-solutions version fared better. For example, in the table below, 36% of clicks were on the solution headline (“How One Non-Profit Is Working To Curb Child Marriage In Rural India”) and 64% were on the non-solution headline (Child Marriage Remains Stubbornly High In Rural India”).
In The Huffington Post tests, however, the addition of a mysterious location or group was not the only difference in each headline pair. For instance, the headlines below differed in whether they described a solution or a problem, in whether they included a mysterious entity, and in other aspects of their phrasing. Because there were multiple differences between each headline in a pair, we did an experiment to find out whether adding a mysterious entity uniquely contributed to people’s evaluations of a solutions headline. In the experiment, we made sure that the headlines were as similar as possible, except for varying whether there was a mysterious entity or not.
Experiment Results
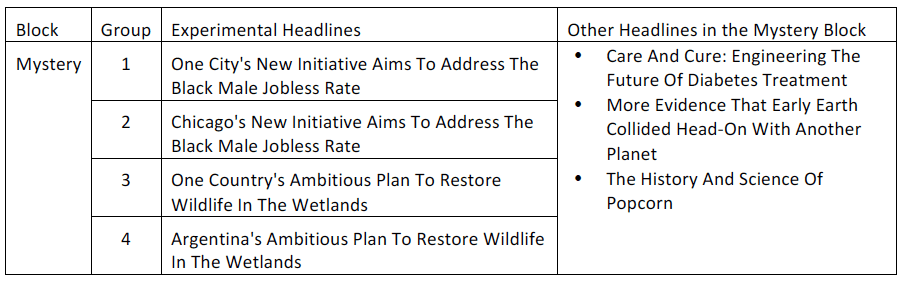
Participants in our experiment saw four lists of four headlines (see the Methodology section below for more details), and were asked to choose which headline they would most like to read. In the case of testing the effects of a mysterious entity, participants saw either a headline that contained an unnamed entity (e.g., “This City’s…”) or one where the entity was identified (e.g., “Chicago’s…”). We calculated the percentage of respondents who chose each headline.
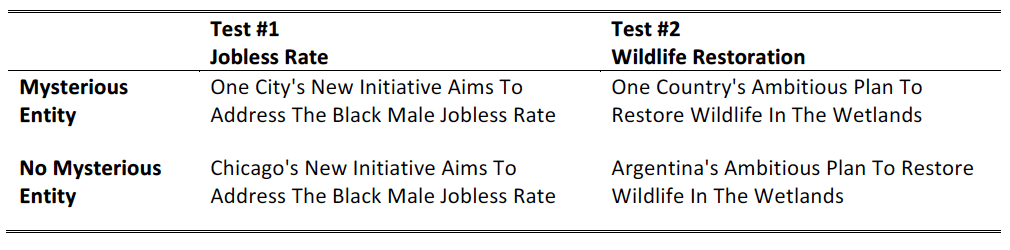
Test #1: Jobless Rate
No statistically significant differences among solutions headlines. There were no statistical differences in participants’ selection of headlines about the jobless rate depending on whether they contained a mysterious entity or not.3
Test #2: Wildlife Restoration
The solutions headline with a mysterious entity (“One Country’s”) outperforms the solutions headline without a mysterious entity (“Argentina’s”). Participants were more likely to select the wildlife restoration headline when the country was not named.4
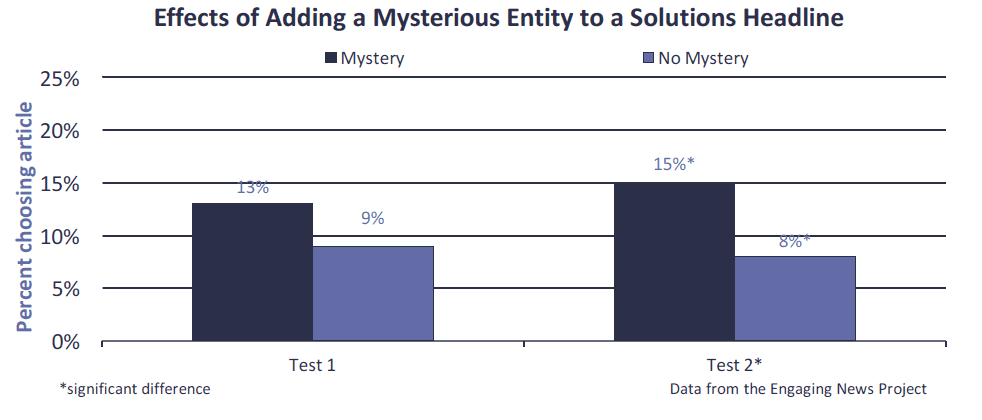
Based on the experiment results, adding a mysterious location or group to a solutions headline can have a positive effect on the click-through rate.
Adding “Simple” Affects Clicks, But Not in a Consistent Manner
The Huffington Post results suggested that adding the word “simple” to a headline may increase engagement with a solutions-based headline. Experimental results, however, showed that adding “simple” reduced interest.
Huffington Post Headline Tests
Six of the solutions headlines from The Huffington Post tests included the word “simple.” Within the data, every time a solutions headline used the word “simple,” it outperformed the non-solutions version. Here are two examples of the use of the word in The Huffington Post solutions headlines:

The headline pairs differed in more ways than just use of the word “simple,” however, making it necessary for us to more systematically test whether “simple” solutions headlines did better than those without the word.
Experiment Results
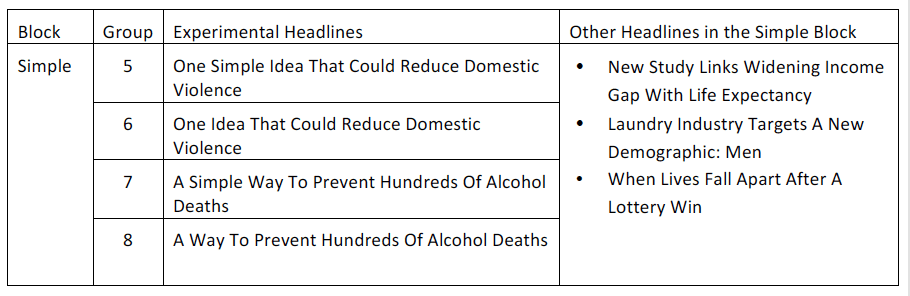
Experiment participants were provided with lists of solutions headlines and asked to select the headline that they would most like to read. Embedded within these lists were manipulations of headlines to either include, or exclude, the word “simple.”
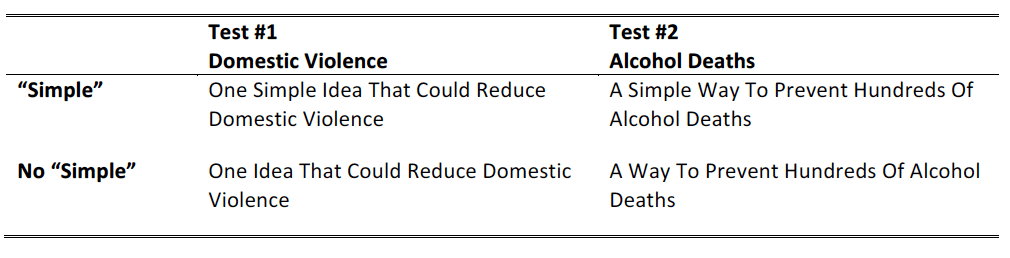
Test #1: Domestic Violence
The solutions headline without “simple” was selected more frequently than the solutions headline with “simple.” When we removed “simple” from the domestic violence headline, more people selected it in comparison to the solutions headline that contained the word “simple.”5
Test #2: Alcohol Deaths
No differences among solutions headlines. Participants were equally likely to select the headlines about alcohol deaths, regardless of whether they included the word “simple.”6

Tacking Information Onto a Headline Doesn’t Increase Clicks
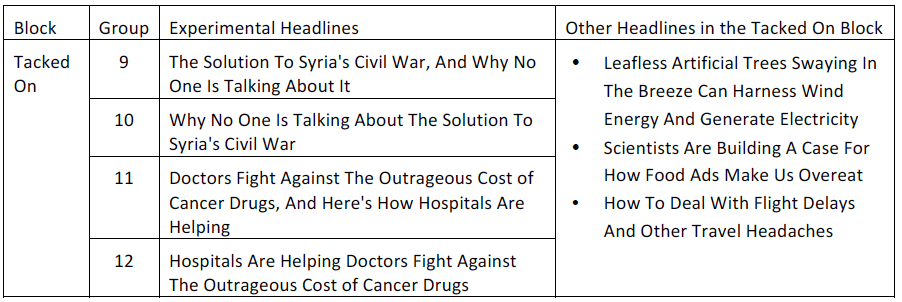
Tacking information on to a headline to make it solutions-focused is another strategy we noticed in The Huffington Post data. In several cases, solutions-oriented headlines were created by adding additional information to the end of a problem-oriented headline (e.g. “Blackouts are a Major Problem. Here’s a Fix.”). As the results below show, there is no systematic evidence that tacking information on to create a solutions headline affects clicks.
Huffington Post Headline Tests
In three of the four cases that The Huffington Post created a solutions headline by tacking information on to the non-solutions headline, the solutions version garnered fewer clicks than the non-solutions version. Based on this observation, we wanted to evaluate whether tacking on information is an effective strategy for headlining a solutions-oriented story. Below are two examples of tacking on information from The Huffington Post headlines.
As before, more varied between the headlines than just tacking on information, necessitating further research. Our experiment results, described below, did not find any effect of tacking on information.
Experiment Results
When presented with the option of choosing a solutions headline that contained a tacked-on portion, or a solutions headline that did not contain a tacked-on portion, there were no differences in how often people selected either headline.7

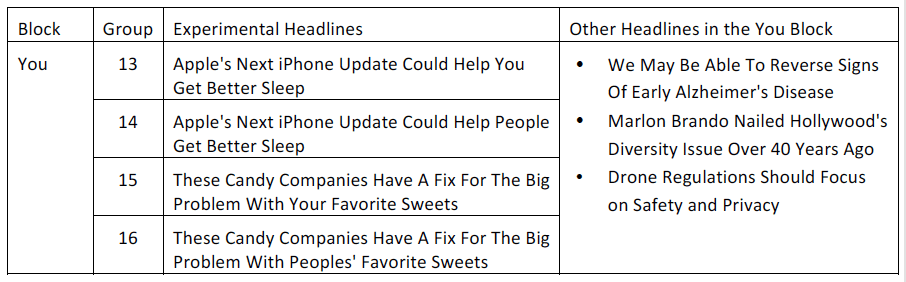
Using the Word “You” in Solutions Headlines Doesn’t Affect Clicks
Another strategy that we noticed was the use of the word “you” in several headlines.
Huffington Post Headline Tests
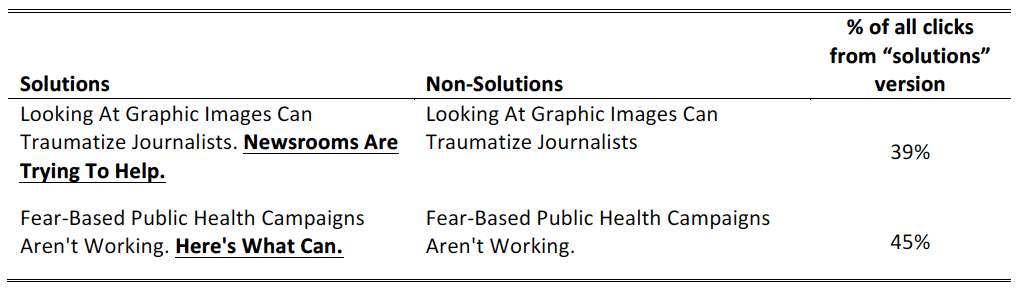
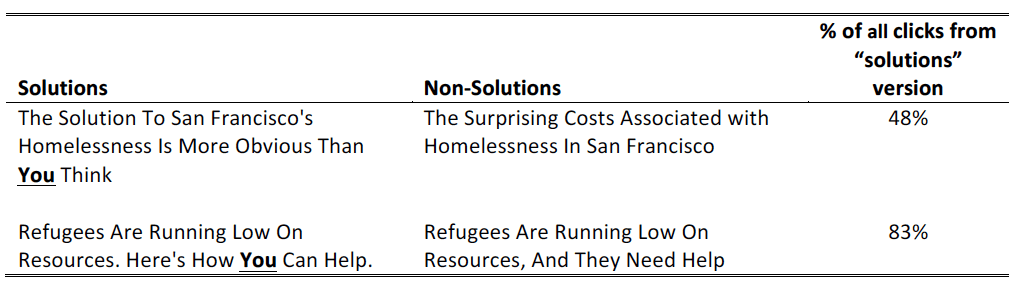
Across The Huffington Post tests, there was variability in whether headlines with “you” attracted more clicks. In some instances, like the first example in the subsequent table, the “you” solutions headline yielded slightly fewer clicks than the non-solutions version. In other instances, like the second example, the solutions version containing the word “you” garnered more clicks than the non-solutions version.
Since multiple variables differed between the headlines – including whether the headline emphasized a problem or a solution, whether the headline included the word you, and other parts of the text – it wasn’t possible to tell from The Huffington Post test what the unique effect of “you” was. For this reason, we conducted the additional tests described shortly.
In the experiment, we analyzed whether the word “you” would affect preferences for solutions headlines. We found no differences in headline selection depending on whether the word “you” was in the headline.8

Methodology
Huffington Post A/B Tests
Between March 2015 and January 2016, the Huffington Post A/B tested headlines on their website. For each of 50 tests, The Huffington Post identified articles containing information about both a problem and a solution. For these articles, a Huffington Post editor wrote a solutions-oriented headline and a non-solutions-oriented headline. These headline options were reviewed by staff from the Engaging News Project and/or the Solutions Journalism Network to ensure that they (a) were as comparable as possible and (b) accurately captured a solution and a problem. The article was then posted to the Huffington Post homepage and the headline accompanying the article was randomized. The Huffington Post kept track of traffic to each article coming from the homepage only; traffic numbers do not include search or social, where there wasn’t any randomization.
Reviewing the headline tests halfway through The Huffington Post project, we inductively came up with four hypotheses to investigate regarding headline performance. As reviewed in the main text, these hypotheses asked about (1) Including a mysterious location or group in the headline, (2) Adding the word “simple” to the headline, (3) Tacking information on to the headline, and (4) Using “you” in the headline. These hypotheses formed the basis of our experiment of headline preferences.
Experiment Regarding Headline Preferences
In March 2016, a survey-based headline preferences experiment was conducted to elaborate on The Huffington Post A/B tests. Respondents were recruited via the data-collection company Survey Sampling International (SSI), which administered the online survey to a nationwide sample of 1,034 American adults.9 Although the respondents were not randomly selected, they are demographically diverse and representative in the sense that the demographics of the SSI panel members completing the studies were selected to match demographic targets of Internet users based on a nationally-representative, random sample survey conducted by the Pew Research Center.
Respondents were randomly assigned to view sets of headlines that contained one experimentally varied headline. Each respondent saw four groups of four headlines, drawn from a pool of sixteen groups (see headline tables below). The respondents randomly saw one headline group from each block. For example, one respondent might have seen group 2 from the Mystery block, group 7 from the Simple block, group 9 from the Tacked On block, and group 15 from the You block. No respondent saw more than one group from any given block. Each group consisted of four headlines: one experimentally manipulated headline, and three other headlines drawn from national news outlets. These “other” headlines were the same for all headline groups in a block. By keeping the “other” headlines the same in each group, we can conclude that differences in headline selection were based on the experimentally manipulated elements of the headlines.
For each list of four headlines, respondents were first asked to identify which headline they most wanted to read or to indicate that they didn’t want to read any of the headlines. If respondents selected a headline on the first screen, they were sent to a second screen and shown the remaining headlines. They were then asked to choose as many of the other articles as they would want to read based on the headline, or to indicate that they didn’t want to read any of the other articles. If, however, on the first screen they indicated that they were not interested in any headlines, they were given a second screen showing the headlines and asking, “if you had to pick one to read, which one would you choose?” The analyses reported in this paper are based on those who selected headlines on the first screen. Replicating the analyses and instead looking at whether each article was selected first or second, or if it was selected when we asked respondents if they “had to pick one,” did not change the results.
SUGGESTED CITATION:
Curry, Alex and Stroud, Natalie Jomini. (2016, June). Solutions Headlines. Center for Media Engagement. https://mediaengagement.org/research/solutions-headlines/
- We tested the result in several ways. First, we assumed that the winning headline had an 80% click-through rate. As people were shown the non-solutions and solutions versions at random, we then calculated the total number of visitors having seen the winning headline and assumed that the same number also saw the losing headline. Based on this assumption, we used regression analysis with fixed effects for the article to analyze whether the solutions wording increased the probability that people would click on the headline relative to the non-solutions version. Results confirmed that this was the case, although the effect was not large nor did it explain a great deal of variance (B = 0.09, SE = 0.002, p < 0.001, R-square = 0.04). Second, we assumed that each headline was seen by 15,000 people. With this test, there again was a small but significant effect of solutions headlines on clicking on the article (B = 0.02, SE = 0.0005, p < 0.001, R-square = 0.13). Third, we assumed that each headline was seen by 3,000 people per hour that the test was conducted on the site (timing varied between three and nine hours). Again, the effect was small, but significant (B = 0.01, SE = 0.0004, p < 0.001, R-square = 0.12). Across these analyses, we used regression analysis, even though our dependent variable was dichotomous (clicked vs. did not click). It is preferable to use logistic regression with a dichotomous variable, but it was not possible to run fixed-effects logistic regression with this dataset. Had we used logistic regression without taking the test fixed effects into account, the conclusion would still stand. [↩]
- We also analyzed whether the results varied depending on how clear the problem and solution versions were. The Center for Media Engagement put all of the headlines into a survey and randomized the order. For each headline, we asked whether it was strongly solution-focused, somewhat solution-focused, neither solution-focused nor problem-focused, somewhat problem-focused, or strongly problem-focused. Six staff members from the Solutions Journalism Network (SJN) rated all of the headlines. We then grouped the tests into two clusters: solutions/non-solutions headline pairs that were maximally different based on SJN internal ratings, and solutions/non-solutions headline pairs that received similar scores on SJN internal ratings. For those tests where the headlines were maximally different, the solutions headline received more clicks than the non-solutions headline in 57% of the cases (n = 23). For those tests where the headlines received similar scores, the solutions headline received more clicks than the non-solutions headline in 43% of the cases (n = 25). We did not include the two instances in which the headlines received similar scores in the analysis. Although the results trended in the expected direction, the difference was not statistically significant (χ2(1) = 2.29, p = 0.13). [↩]
- There was not a significant difference between the conditions, χ2(1) = 2.21, n.s. [↩]
- There was a significant difference between the conditions, χ2(1) = 6.82, p < .01. [↩]
- There was a significant difference between the conditions, χ2(1) = 4.40, p < .05. [↩]
- There was not a significant difference between the conditions, χ2(1) = 0.19, n.s. [↩]
- There was not a significant difference between the conditions in Test #1, χ2(1) = 1.19, n.s., or Test #2, χ2(1) = 2.32, n.s. [↩]
- There was not a significant difference between the conditions in Test #1, χ2(1) = 0.84, n.s., or Test #2, χ2(1) = 0.06, n.s. [↩]
- Although 1,078 people were sampled, we excluded some participants from the final analysis, including those who did not meet the age (above 18 years old) or residency (resident of the U.S.) requirements (n=11); those who straight-lined to the attitude questions (n=24); and those who were sampled twice (n=9). [↩]