


Mobile news notifications alert users when breaking news is happening. The brief headlines that flash on a phone’s lock screen provide a snippet of newsworthy world events. They represent an opportunity for news organizations to reach users; rather than requiring people to go to a news app or website, news is pushed to people who want it.
Much remains unknown about notifications. What’s the economic benefit? Newsrooms know how many people allow notifications, but it’s not always possible to track whether notifications drive people to a news organization’s app or website. If notifications don’t push people to news products, then do they have revenue implications? Or are they just a perk for loyal audiences who download the app and say yes to receiving alerts?
Notifications are also interesting from a democratic angle. They represent an opportunity for incidental exposure, or encounters with the news when one wasn’t intending to seek news. But it’s not clear whether mobile notifications help to inform the public, or if the snippets only provide information to those who would have heard the news somewhere else.
In this study, we analyzed what happens when people enable mobile news notifications on their smartphones. We conducted a two-wave experiment with 420 people. In the pre-wave, study participants told us about their mobile phone habits. We then asked them, at random, to download the CNN app, the BuzzFeed News app, or the E! News app. We also asked them, again at random, either to enable or to disable notifications for the app. This gave us six different experimental conditions. Approximately two weeks later, we re-contacted the study participants and asked them to tell us about their experience with the app. This project was funded by the John S. and James L. Knight Foundation. More details about the study can be found in the method section at the close of this report.
Overall, the results show some benefits to notifications: people appreciate the content, half of the respondents reported that they used an app and website because of the notifications that they had received, and, at least in some circumstances, people gain knowledge from the notifications. But the results also show the need for further development: not all of the mobile alerts increase knowledge and some respondents crave the ability to tailor them.
Key Findings
The full study results, detailed in this report, show:
- Those asked to install an app and allow notifications reported using the app more frequently than those asked to install the app without allowing notifications.
- Notifications significantly increased knowledge in some instances.
- Older respondents had greater intentions than younger ones to keep the news notifications installed on their phones.
- Half of the respondents who reported allowing notifications said that they went to the news organization’s app or website in response to a notification.
- When asked what they liked most about notifications, many mentioned the relevant content and useful information. When asked what they liked least, people often mentioned the frequency of notifications and the untailored content.
Implications for Newsrooms
Mobile news alerts have potential. At least in some instances, they can inform the public about what is happening in the news. They also prompt people to engage more with a news organization by going to the organization’s app or website. But this report also leaves the door open for more research, more innovation, and more questions.
First, why do some news notifications increase knowledge more than others? We should evaluate what time of day and what type of notification content prompts learning and engagement. Second, several participants explicitly mentioned their interest in tailored notifications; how do people interact with tailored notifications and how can tailoring best increase knowledge and engagement? Although these questions represent next steps, the current project also provides insights to newsrooms interested in mobile notifications. Most importantly, this research provides evidence that mobile alerts can make both business and democratic contributions.
The Study
Notifications Increase App Use
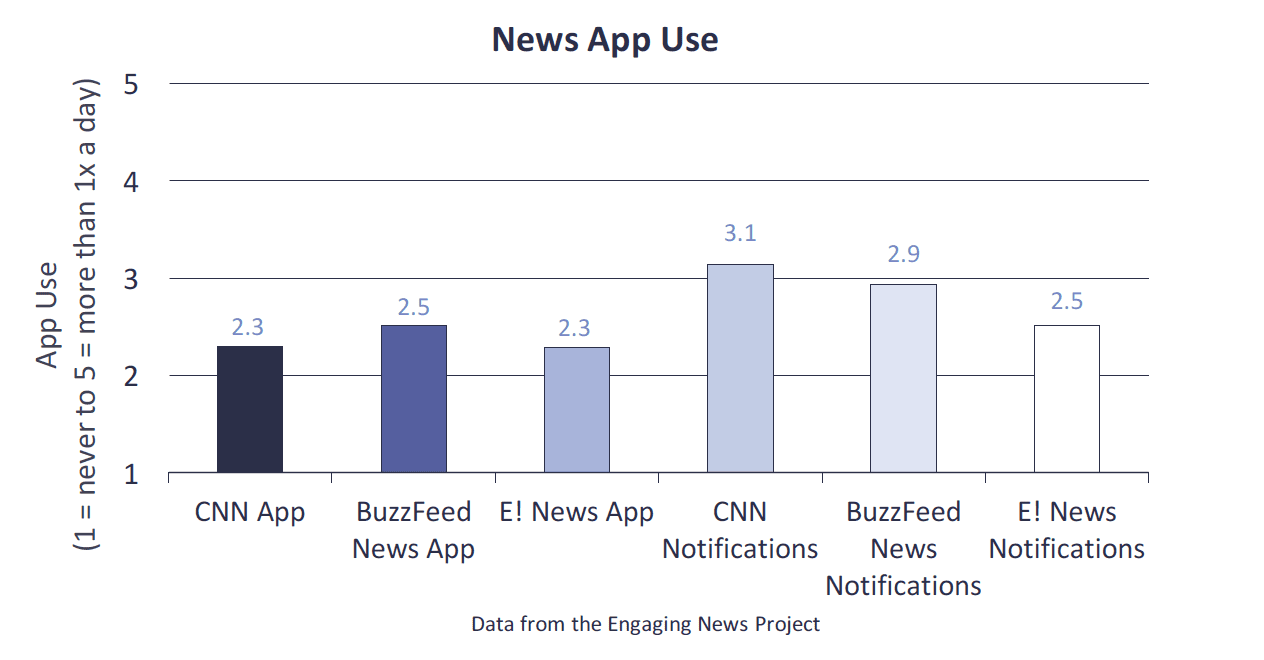
Overall, those asked to install the app with notifications reported significantly higher app use than those asked to install the app without notifications.1 Twenty-seven percent of those asked to install the app with notifications used it daily or more often compared to 12% of those asked to install the app without notifications.
On a scale from 1 (never use the app) to 5 (use the app more than once a day), average app use for those asked to download the app, regardless of the source, was 2.31. Average app use for those asked to allow notifications was 2.85. This difference is statistically significant. App use by experimental condition is shown in the chart below.
Notifications Can Increase News Knowledge, But They Don’t Always
After study participants had the app for approximately two weeks, we gave them a six question quiz about notifications that had been sent by both CNN and BuzzFeed News.2 On average, study participants answered 3.55 of the six questions correctly. There were no differences across the conditions in how many questions study participants answered correctly.3
We also asked three quiz questions related to notifications sent by BuzzFeed News, but not by CNN or E! News. On average, study participants answered 0.96 of the three questions correctly. Those assigned to receive the BuzzFeed News notifications did not answer more of these questions correctly than other participants.4
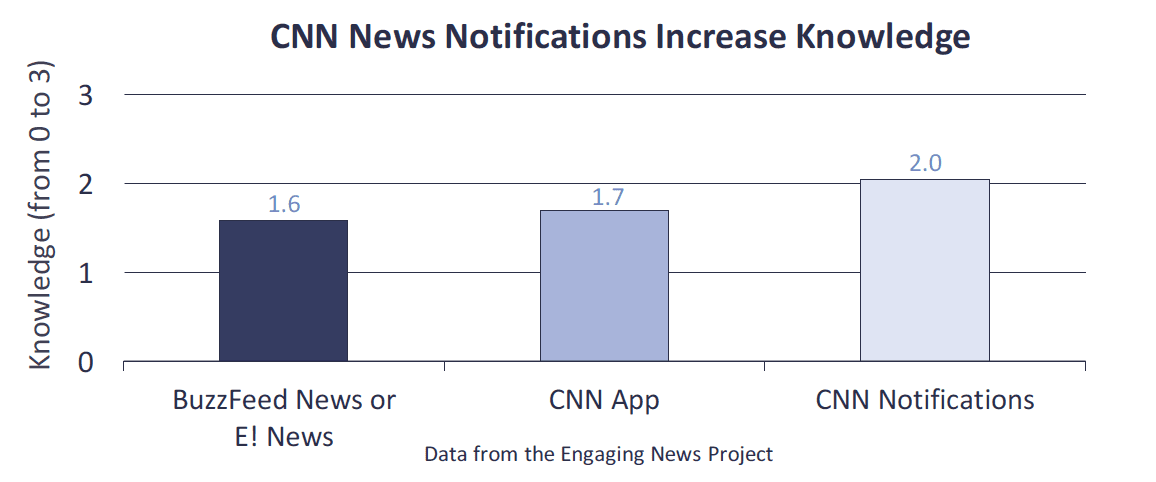
Finally, we asked study participants three knowledge questions about the notifications sent by CNN, but not by BuzzFeed News or E! News. Forty percent of those assigned to receive CNN news notifications answered all three of these knowledge questions correctly; only 20% of those in the other experimental conditions did so.
On average, study participants answered 1.66 of the questions about CNN notification content correctly. Those assigned to receive CNN notifications answered more of the knowledge questions correctly compared to those in the other conditions.5 Further, those assigned to receive CNN notifications were more knowledgeable than those assigned to download the CNN app without allowing notifications.6 This finding is shown in the next chart.
Our data cannot tell us why some notifications increased knowledge and not others. Speculatively, it could be that notifications sent by both CNN and BuzzFeed News represent information that was widely distributed. Even those who don’t get notifications may eventually learn the information. The lack of an effect for BuzzFeed News could be attributed to the difficulty of the questions that we asked.7 It also could have something to do with the way in which the BuzzFeed News notifications were phrased, or when they arrived on people’s phones. Future research should look more carefully at whether there are features of the notification design that increase or inhibit learning and engagement.
Older Respondents More Satisfied, More Likely To Keep News Notifications
We asked respondents to tell us what they thought about the news notifications they received. For this section, we look only at those who were assigned to receive BuzzFeed News or CNN notifications, as we didn’t have a substantive interest in the reactions of those receiving entertainment news notifications.
We analyzed whether there were differences based on respondents’ gender, age, education, race, phone type, news app use prior to the experiment, and use of notifications prior to the experiment. Age was the only factor that exerted a consistent effect. Seventeen percent of 18-29 year olds said that they were very likely to keep the notifications on their phone compared to 27% of 30-49 year olds and 37% of 50+ year olds.
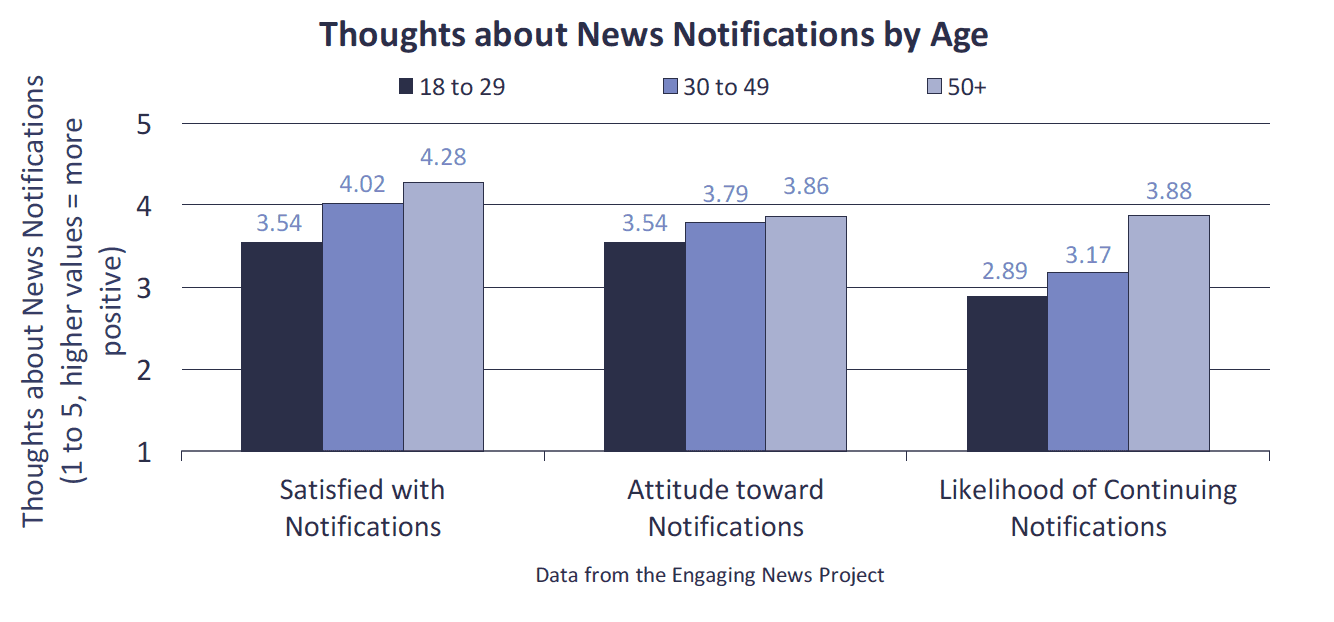
Among those receiving either BuzzFeed News or CNN notifications, older respondents were more satisfied with the notifications than younger respondents.8 They also had more positive attitudes toward notifications (an average of their thoughts about how helpful, beneficial, informative, interesting, and not annoying the notifications were).9 Finally, older respondents were more likely to say that they would keep the notifications on their phone after the study ended.10 Those receiving BuzzFeed News notifications and those receiving CNN notifications gave similar responses across these measures.
Half of Respondents Went to News App or Website After Receiving Notification
We also asked those assigned to receive BuzzFeed News or CNN notifications about what they did with the information that they received. Three-quarters of respondents (75.8%) indicated that they knew that the news app would open if they swiped the notification.
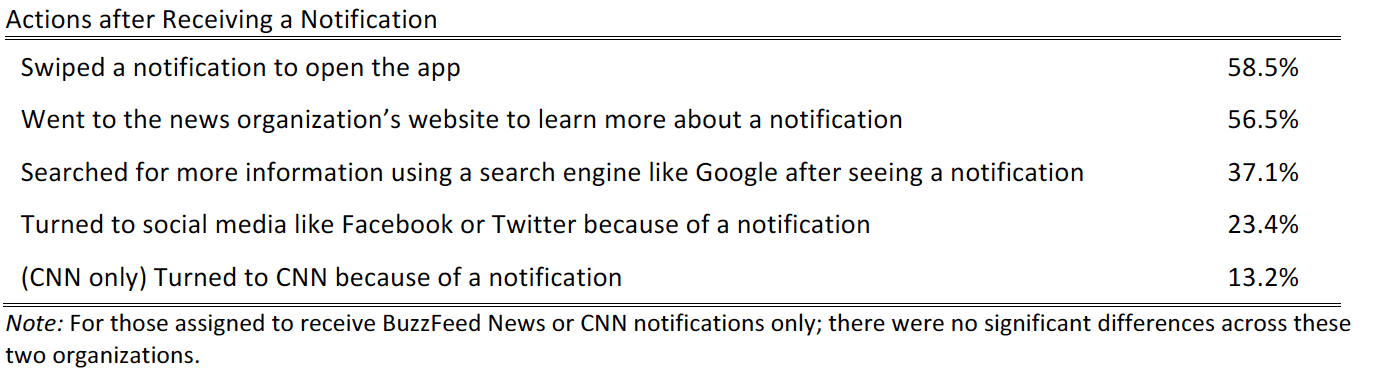
As shown in the table below, over half of those receiving news notifications opened the app or went to the news website to learn more about a notification. Just over a third (37.1%) searched for more information after seeing a notification and just under a quarter (23.4%) turned to social media after seeing a notification.
Among those receiving CNN notifications, 13.2% said that they turned to CNN because of a notification.
Content of Notifications is Both the Most and the Least Liked Aspect
Study participants were given several opportunities to share with us, in their own words, what they thought about the apps and notifications included in the study. We analyzed their responses and include the details below.
Least, Most Liked Aspects of Notifications
We asked all 208 respondents who indicated that they had allowed notifications on their phone as part of the study to tell us what they liked least. The top two reasons mentioned had to do with the content and the quantity of the notifications.11
Nearly a third (32.4%) mentioned that they did not like something about the notifications’ content.
“Too many and about meaningless junk.”
“Because it was not tailored to my needs and gave me information on things I do not care about.”
“It’s random topics. I wish I could filter. For instance, say no to Olympic news.”
Just over twenty percent (20.8%) said that the quantity and timing of the notifications were least liked.
“Too many.”
“Times it would go off.”
“I would want to choose how often I get notifications.”
After asking them about what they liked least, we asked study participants to tell us what they liked most. A majority of participants (63.8%) said that they most liked the content of the notifications, seeing it as interesting, relevant, and helpful for keeping the user informed.12
“It was informative about recent topics. Olympics, presidential election etc.”
“Got breaking news that I wasn’t expecting.”
Uninstalled the App, Turned Off Notifications
In the post-wave of the study, we asked respondents if the app was still installed on their phone. Forty-eight study participants indicated that they had uninstalled it. There were no differences across the conditions in whether respondents uninstalled the app.13 We asked respondents an open-ended question about why they uninstalled the app and then analyzed their responses. The top three reasons mentioned are described below.14
Nearly forty percent (39.6%) indicated that they uninstalled the app because they did not use or enjoy it.
“It is useless.”
“I honestly did not enjoy the E! News app.”
Others (37.5%) mentioned their device or data plans as reasons for uninstalling the app.
“I got a new phone.”
“I didn’t want to use up all my memory.”
Nearly a quarter (22.9%) said that the content led them to uninstall the app.
“The app did not have news that interested me.”
“I was not as interested in celebrity news as I thought I would be.”
“I don’t think any of the major news networks are a good way to get information.”
We also asked study participants in the post-wave if they turned off notifications. Thirty respondents indicated that they had done so at some point during the study. Again, there were no differences across the conditions.15 We coded the open-ended responses to understand why these study participants turned off notifications. Again, the top three reasons are described below.16
One third (33.3%) of respondents mentioned that the content was uninteresting or the information off-putting.
“I don’t care about the news.”
“The information they were giving me didn’t feel relevant enough for the distraction.”
“I was getting notified about things I couldn’t possibly care about.”
Thirty percent (30.0%) indicated that the quantity or timing of the notifications motivated them to remove the alerts.
“Too many.”
“Waking me up at night.”
Just over a quarter (26.7%) had a general distaste for notifications.
“I don’t like app notifications in general.”
“It is annoying.”
“I found them to be obtrusive and annoying after a while.”
Methodology
Experimental Participants and Protocol
We conducted the experiment using data from Survey Sampling International (SSI) and Amazon.com’s Mechanical Turk (mTurk). With SSI, we collected data in two rounds. Anyone age 18 and older who was a U.S. resident was permitted to participate. We did this so we could understand who would, and who would not, participate in a study like this and why. The Round 1 pre-wave was completed July 15-20, 2016 and the post-wave from July 28- August 12. The Round 2 pre-wave was conducted between August 4-7, 2016 and the post-wave from August 17-23. In the Round 1 pre-wave, 471 people participated in the study. Of the 471, 54 did not have a phone with Internet access, 163 indicated that they were not interested in downloading an app for the study, 33 reported that they did not successfully download the app and install notifications as requested, 35 left junk data in open-ended fields (e.g. strings of letters), and 26 did not provide a headline indicating that they had correctly installed the app. The remaining 160 were invited to complete the study post-wave. A total of 111 completed the post-wave (69%).
In the Round 2 pre-wave, 586 people participated. Of these, 57 did not have a phone with Internet access, 229 indicated that they were not interested in downloading an app for the study, 63 reported that they did not successfully download the app and install notifications as requested, 34 left junk data in open-ended fields (e.g. strings of letters), and 68 did not provide a headline indicating that they had correctly installed the app. The remaining 135 were invited to participate in the post-wave. In total, 110 completed the post-wave (81%).
For SSI, we examine the qualities that prompted participation in the study versus other sample dispositions, including not having the technological opportunity to participate (no Internet on phone), not having interest in participating, and not having the technical skill required (unsuccessful download). Differences are shown on a table in the full report.
There are differences by gender, but when doing post-hoc comparisons using a Bonferroni correction, none of the pairwise comparisons are significant. Neither race nor Hispanic ethnicity differed across the possible outcomes. Age was significantly different. Those age 50 and above were more likely to have no Internet on their phones than to express disinterest, have difficulties downloading the app, or be eligible for the post-wave. Those age 30 and above were more likely to say that they were not interested than to be eligible for the post-wave. The age distribution of those who were not interested in downloading an app as part of the study, however, is quite similar to the overall sample demographics. Those with lower levels of education and lower incomes were more likely to not have a phone with Internet access than to be eligible for the post-wave study.17,18,19,20,21
We also used Amazon.com’s mTurk to gather respondents. mTurk respondents were required to be 18 years of age or older, to be U.S. residents, and to indicate that they were willing to participate in a study that would require them to download a popular app on their smartphone. The pre-wave of the study on mTurk was completed by 283 respondents from August 4-9. Of these, we invited 253 to participate in the post-wave. Respondents were not invited for the post-wave if they reported that they weren’t able to correctly install the app or notifications as requested (n = 24) or did not provide a headline indicating that they had correctly installed the app (n = 6). Of the 253 receiving an invitation to complete the post-wave, 199 (79%) completed the post-wave. The post-wave was conducted from August 17-24.
We combined the SSI and mTurk samples to form our final study sample and present the demographic statistics in the table below. Compared to the Pew Research statistics for those with a smartphone, our sample has fewer individuals with low levels of education and more with some college. Our sample also has a higher percentage of people with incomes between $30-75k and fewer with incomes $75k and above. Other differences are smaller, but our sample also is younger, less racially diverse, and more female than the comparable numbers from Pew.
Using cross tabulations and ANOVAs, there were no significant differences across the conditions for any of the demographic characteristics during the pre-wave or the post-wave.
Overall, 74% of respondents gave responses in the post-wave indicating that they were treated as assigned. These people reported in the post-wave that they received notifications when they were asked to allow notifications in the pre-wave or that they did not receive notifications when they were asked to say no to notifications in the pre- wave. This also includes 15 people who admitted that they did not install the app in the pre-wave. There are different strategies for handling non-compliance in research like this. For the analysis reported here, we use an ITT (intent to treat) strategy and report on the results based on the condition to which people were assigned, regardless of what they reported in the post-wave.
App Selection and Notifications Details
We evaluated several news apps before settling on CNN, BuzzFeed News, and E! News. We looked for apps that were similarly easy to download and install apps on both the iPhone and Android. We also sought out apps that did not require a subscription. Further, some apps had a different design on the iPhone and Android and we avoided these as well. CNN and E! News asked those who downloaded their app to allow notifications. BuzzFeed News auto-enrolled people in notifications and they had to opt-out. All three, however, were similar across the iPhone and Android phones that we examined and were similarly easy to install.
We captured notifications during the study across several phones and locations. We did this because during pre- testing, we noticed that the notifications received were different across phones. It also wasn’t clear whether CNN or BuzzFeed News were tailoring notifications by location (both organizations declined to disclose this information). We recorded all notifications that we received across four different phones: An Android phone located in Austin, Texas with location enabled, an iPhone located in Austin where we did not enable the app to access our location, an iPhone located in Austin where we did enable the app to access our location, and an Android phone in Lawrence, Kansas with location enabled. The most consistent difference was that the Android phone in Austin received only a subset of the notifications that the iPhones received, while the Android phone in Lawrence received nearly all of the same notifications that appeared on the iPhones. There also were a few instances in which the location-enabled phone did not receive notifications that the other did (or vice versa).
Between July 20 and July 28 (the last day of Round 1 pre-wave and the first day of Round 1 post-wave), BuzzFeed News sent 35 notifications, CNN sent 44, and E! News sent 2. Between August 9 and August 17 (the last day of Round 2 pre-wave and the first day of Round 2 post-wave), BuzzFeed News sent 30 notifications, CNN sent 23, and E! News sent 7. We used these notifications to form our knowledge questions.
We asked study participants on the post-wave survey to tell us the type of phone on which they downloaded the app. The majority had downloaded the app on an Android device (59.2%). Forty percent (39.8%) had done so on an iPhone and 1 percent had used a non-Android, non-iPhone device. There were no significant differences across conditions in terms of those who used an Android and those who used another type of phone (χ2(5) = 5.80, p = 0.33).
SUGGESTED CITATION:
Stroud, Natalie Jomini, Peacock, Cynthia, and Curry, Alex. (2016, October). Mobile news notifications. Center for Media Engagement. https://mediaengagement.org/research/mobile-news-notifications
- The difference between being assigned to have the app and being assigned to have the app with notifications is statistically significant using an ANOVA with a planned comparison F(1, 407) = 24.89, p < 0.01. This analysis controls for whether respondents were part of the first or second round of analysis and whether they were gathered using mTurk or SSI. [↩]
- Each knowledge question had four possible response options. For example, one question asked, “What happened in Milwaukee?” with response options: Large crowd protesting a police shooting turned violent, Record temperatures responsible for four deaths, Tainted cheese traced back to Kraft plant, Residents evacuated after record rainfall. The order of the response options was randomized across study participants. The knowledge questions differed in Round 1 and Round 2 of the study, but we controlled for the round and source of participants (mTurk or SSI) throughout the analyses. [↩]
- The difference between being assigned to receive CNN or BuzzFeed News notifications and the other conditions was not statistically significant using an ANOVA with a planned comparison F(1, 402) = 0.29, p = 0.59. This analysis controls for pre-wave news knowledge. [↩]
- The difference between being assigned to receive BuzzFeed News notifications and the other conditions was not statistically significant using an ANOVA with a planned comparison F(1, 394) = 1.63, p = 0.20. This analysis controls for pre-wave news knowledge. [↩]
- Those receiving CNN notifications had higher CNN notifications-based knowledge than those in the other conditions, evaluated using an ANOVA with a planned comparison F(1, 400) = 11.37, p < .001. [↩]
- Those in the CNN notifications condition had more CNN notifications knowledge than those in the CNN app condition, evaluated using an ANOVA with a planned comparison F(1, 400) = 4.52, p < .05. [↩]
- People received lower scores on the BuzzFeed News notifications quiz than they did on the CNN notifications quiz (paired t(403) = 11.26, p < .001). [↩]
- We included gender, education, age, race, condition (BuzzFeed News or CNN), phone type (Android or iPhone/other), news app use prior to the experiment, and notifications received prior to the experiment in a regression analysis predicting push satisfaction with the question “Overall, how satisfied or dissatisfied were you with the <organization> notifications that you received as part of this study?” Only age (B = 0.02, SE = 0.01, p < .01) was significant (model R-square = .14). [↩]
- Respondents were asked to indicate how helpful, beneficial, informative, interesting, and not annoying the notifications were using 5-point semantic differentials. The measures were strongly related to one another (Cronbach’s alpha = 0.90) and were averaged to form one measure of attitudes toward notifications. In a regression analysis identical to the satisfaction analysis described in the previous footnote, age again was the only significant predictor (B = 0.01, SE = 0.01, p < .05; model R-square = .14) [↩]
- Respondents were asked how likely or unlikely they were to continue receiving notifications from <organization>. In a regression analysis including the same predictors as those described for notification satisfaction, age again was the only significant predictor (B = 0.03, SE = 0.01, p < .01; model R-square = .13). [↩]
- We had two coders independently evaluate 20% of the responses. We evaluated the reliability of the codes using Krippendorff’s alpha, a measure that ranges from 0, indicating no agreement adjusting for chance, to 1, indicating perfect agreement. Values about 0.80 are considered strong and above 0.67 acceptable. For the content coding, Krippendorff’s alpha was 0.86. For quantity, it was 0.94. [↩]
- We again assessed reliability using Krippendorff’s alpha, for the content measure, it was 0.91. [↩]
- The chi-square test indicated that there were no differences across the conditions in uninstalling the app, χ2(5) = 4.44, p = 0.49. [↩]
- Two coders independently coded 38 of the responses. Krippendorff’s alpha was 0.74 for a general distaste for notifications, 1.00 for the quantity or timing of notifications, and 0.75 for notification content. [↩]
- The chi-square test indicated that there were no differences across the conditions in turning off notifications, χ2(2) = 0.79, p = 0.67. [↩]
- Two coders independently coded 20 of the responses. Using Krippendorff’s alpha, the coding was reliable for the content of the notifications (0.77), the quantity of notifications (0.88), and a general distaste for notifications (0.83). [↩]
- There were significant gender differences by sample disposition χ2(3) = 8.24, p < .05. [↩]
- There were not significant differences by race χ2(6) = 6.57, p = .362 or Hispanic ethnicity χ2(3) = 7.05, p = .07 by sample disposition. [↩]
- There were significant age differences across the sample dispositions, χ2(9) = 119.83, p < .001. [↩]
- There were significant education differences across the sample dispositions, χ2(6) = 18.85, p < .01. [↩]
- There were significant income differences across the sample dispositions, χ2(6) = 25.39, p < .01. [↩]