


SUMMARY
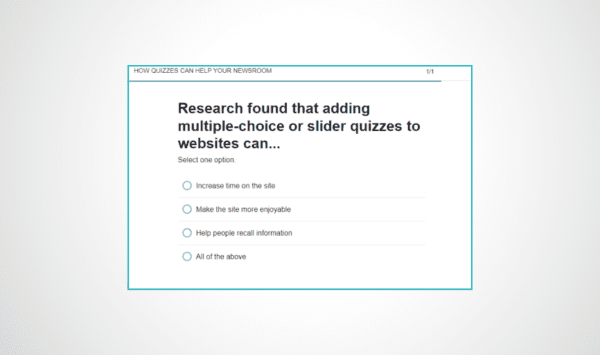
The Center for Media Engagement found that online quizzes present many benefits: They’re enjoyable, they help people to learn, and they encourage people to spend more time on a webpage.
Although both slider quizzes and multiple-choice quizzes have benefits, people are better able to recall and recognize information when using a slider quiz.
To get the most benefits from quizzes, newsrooms should add more than one question using different quiz formats to increase engagement. Newsrooms should also consider using quizzes for hard news stories and using quizzes as an opportunity to share factual, reputable data.
THE PROBLEM
Many news sites feature online polls that typically ask visitors about their opinions, such as whether they favor or oppose a new policy or who they want to win an upcoming election. Online quizzes, where people are asked factual questions and then are told whether their responses are correct or incorrect, are less common.
The appeal of these interactive features is obvious: Polls and quizzes are familiar to site visitors, making participation easy. Further, the interactivity can engage site visitors and yield commercially-desirable outcomes, such as increasing time on a site.
Using online polls, however, does have downsides:
- Some users may believe that online poll results are accurate reflections of public opinion when, in fact, they often are not1
- Some online polls allow site visitors to vote multiple times,2 allowing for someone with a strong opinion to change the distribution of the results to favor his/her view
- News sites often do not include a disclaimer warning respondents that the results are not scientific3
- When topics turn to political news, polls can leave citizens more cynical about the political process. For example, by focusing on who will win an election or including response options such as “Who cares? It won’t matter who wins,” polls can fuel citizen alienation from politics and distrust of politicians
Instead of using polls that provide site visitors with information about other users’ responses, we recommend that newsrooms use quizzes that present reliable public opinion estimates and factual data from reputable sources.
In this study, we look at how multiple-choice quizzes and slider quizzes affect how people learn and how people feel about different types of quizzes. These outcomes are critical building blocks for an informed and engaged citizenry. We also analyzed reported enjoyment and time spent with different types of quizzes, which are important for newsroom business goals.
KEY FINDINGS
Compared to presenting factual information without an interactive feature, online slider and multiple-choice quizzes:
- Increase time on site
- Are seen as more enjoyable
- Help people recall information
Slider quizzes also have unique benefits when compared to multiple-choice quizzes. Specifically, slider quizzes:
- Help participants recall and recognize information at similar rates. In contrast, when taking multiple-choice quizzes, people can recognize information better than they can recall it.
When using quizzes, newsrooms should:
- Add more than one question using different formats on a page to increase engagement
- Present content that uses reliable public opinion estimates and factual, reputable data
- Be on the lookout for statistical and numerical data that can be used to create quizzes
IMPLICATIONS FOR NEWSROOMS
Online quizzes present many benefits: They’re enjoyable, they help people to learn, and they yield more time on a webpage. Our recommendation is that online news sites use quizzes to meet both business and journalistic goals.
Although slider quizzes are in many ways similar to multiple-choice quizzes, they present some unique benefits. They help people to recall more information, whether they’re asked about the information using open-ended, fill-in-the-blank quiz questions or whether they’re asked about the information using closed-ended, multiple-choice quiz questions. For multiple-choice quizzes, people are better able to answer the closed-ended questions than they are the open-ended questions.
Though quizzes can help newsrooms meet their business goals, they do not always advance a newsroom’s journalistic mission. Entertainment and sports-based questions might engage and entertain visitors, but they fail to inform citizens about important policy topics that may impact their lives. Newsrooms should consider adding substantive, hard news content to quizzes. Quantitative information, in particular, is easily incorporated into these interactive formats.
THE EXPERIMENT
In our research, the slider quizzes resembled open-ended questions that asked respondents to use their own knowledge to answer questions instead of choosing from a predetermined set of answers. We analyzed how multiple-choice or slider quizzes engaged and educated site visitors. We compared these two types of quizzes to non-interactive presentations of quiz information.
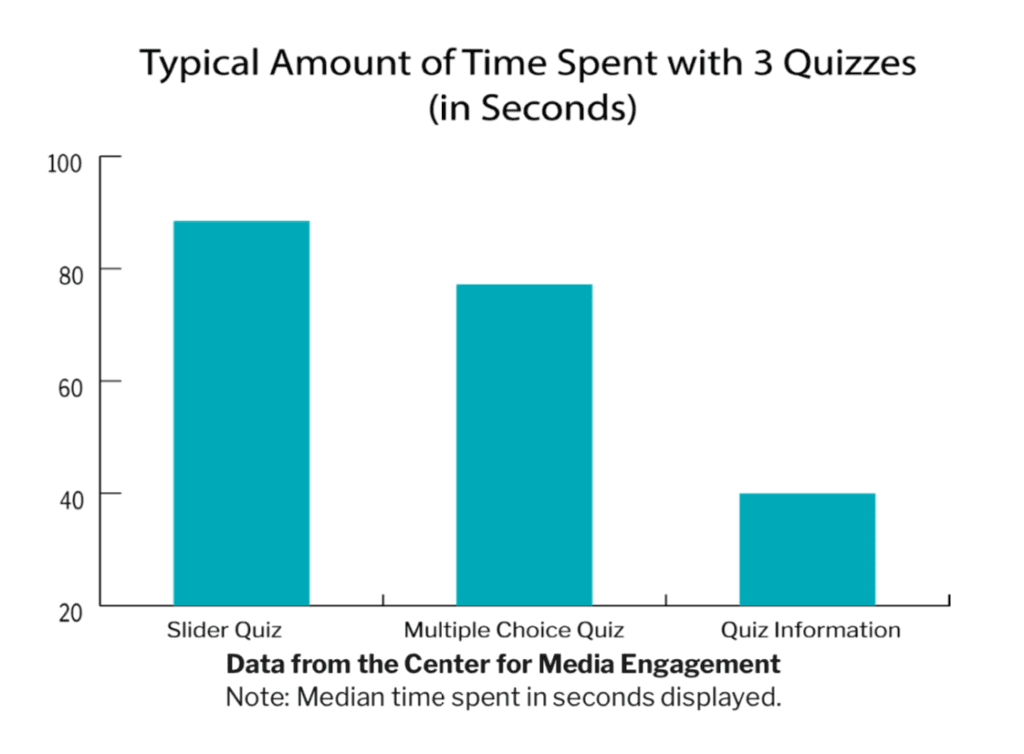
 People devoted more time to interactive quizzes
We added up the amount of time each participant spent with three slider quizzes, three multiple-choice quizzes, or three descriptions of the quiz information. People spent more time with the Slider Quizzes and Multiple-Choice Quizzes than they did with the Quiz Information.4
Slider quizzes helped people learn and apply their knowledge
Near the end of the study, participants were asked a series of quiz questions about the information presented on health care, taxes, and budgets. A random half of participants were asked these questions in a closed-ended format resembling the multiple-choice quizzes. The other random half of participants were asked these questions in an open-ended, fill-in-the-blank format resembling the slider quizzes.
Those in the Slider Quizzes and Multiple-Choice Quizzes conditions knew more than those in the Quiz Information and Control conditions.5 There were no differences between the Slider Quizzes and Multiple-Choice Quizzes conditions in how many quiz questions respondents answered correctly.
Regardless of whether they were asked closed-ended or open-ended quiz questions, respondents in the Slider Quizzes condition answered the same number of knowledge questions correctly. Yet participants in the Multiple-Choice Quizzes, Quiz Information, and Control conditions answered more questions correctly when asked closed-ended questions in comparison to open-ended questions.6 In other words, those in the Slider Quizzes condition were equally able to recall and recognize the information from the quizzes while those in the other conditions were better able to guess the right answer when asked the closed-ended question than the open-ended question.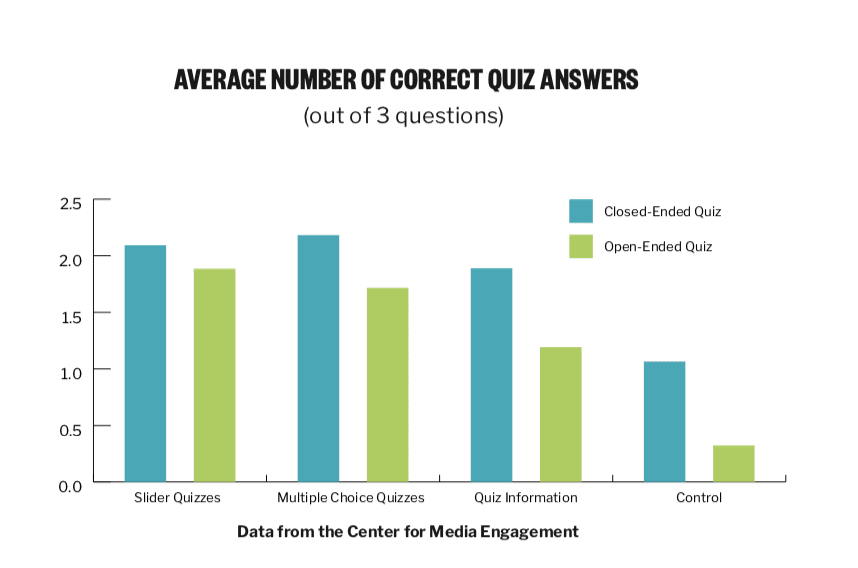 Interactive quizzes are more enjoyable than reading the results, and are just as clear and informative
Participants were asked to indicate whether they found each quiz enjoyable, interesting, informative, clear, credible, and trustworthy. There were no differences across the conditions for any of these measures except for enjoyment. Participants were asked to rate how boring or enjoyable they found the quiz from 1 (boring) to 5 (enjoyable). Participants found the Multiple-Choice Quizzes and Slider Quizzes more enjoyable than the Quiz Information.7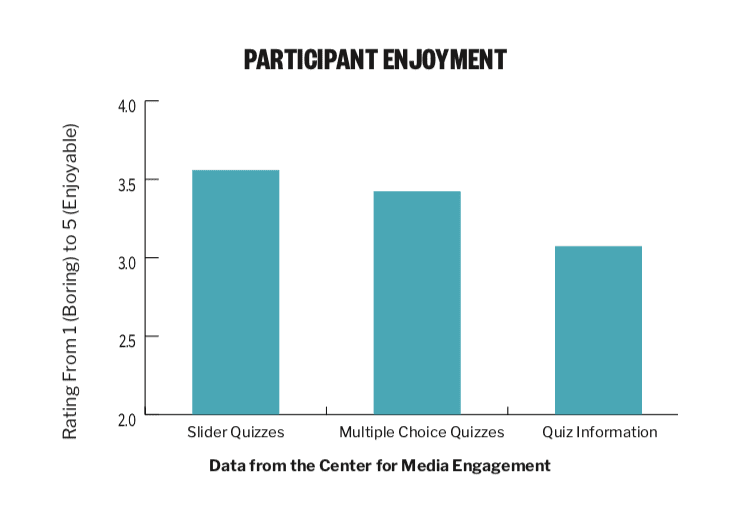 Results hold for different education levels
One important question about these findings is whether they apply only to those with higher levels of education. We analyzed whether our significant findings about (a) the amount of time spent with the quizzes, (b) enjoyment, (c) knowledge, and (d) confidence in one’s knowledge were different among those with higher levels of education compared to those with lower levels of education. In no instance were there significant differences among those with a high school education or less, those with some college, and those who had graduated college.
When presenting one quiz on a news site, engagement is similar whether you start with a slider or multiple-choice question.
We partnered with a local newsroom to test whether the first question in a quiz should use a multiple-choice or slider format. We randomly varied whether people saw a multiple-choice or slider quiz question about vehicle burglaries. People were equally likely to participate whether the quiz question used a multiple-choice (7.6%) or slider (7.2%) format. Time spent on the page was also similar regardless of which quiz format was used.8
In a second test, we embedded a quiz about guns on a local news webpage and varied whether it began with a slider or multiple-choice format. There were no differences in taking the quiz between those who first saw the slider quiz (38.1%) and those who first saw the multiple-choice quiz (37.8%) in their decision to start taking part in the quiz.9
For this second test, the quiz consisted of seven questions. Of those who did participate in the quiz, they completed an average of 4.41 of the seven quiz questions. The more quiz questions that respondents completed, the more time they spent on the site.10
When presenting two quiz questions on a news site, using different types of questions increases engagement
If a newsroom wants to embed more than one quiz on a webpage, engagement is higher if the two quizzes use different formats (one multiple-choice and one slider) than if both quiz questions use the same format.
A local newsroom included two quizzes on an article page and varied whether they (a) were both multiple-choice questions, (b) were both slider questions, or (c) included one slider and one multiple-choice question. When there were two different types of questions, site visitors participated in an average of 0.21 quizzes, whereas those that saw two of the same types of questions participated in an average of 0.11 quizzes.11
Time on page was also higher when two different quizzes were used compared to two quizzes with the same format.12
METHODOLOGY
Online Experiment
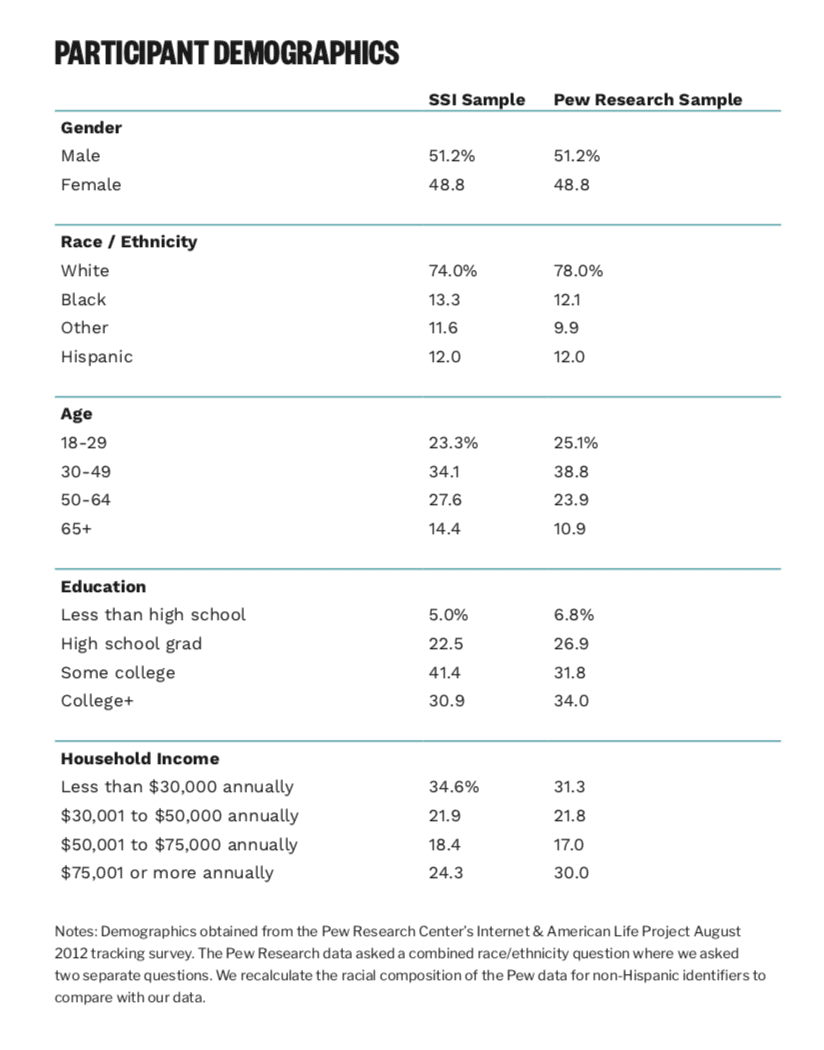
Four hundred and fifty-six people participated in this study. Participants for this study were recruited through Survey Sampling International (SSI), an online survey panel vendor, to mirror the latest sample of Internet users in the United States as identified by the Pew Research Center’s Internet & American Life Project August 2012 tracking survey. Data for this study were gathered in early October, 2012.
Study participants answered questions about how enjoyable, interesting, informative, clear, credible, and trustworthy the quizzes were. Participants also answered recall questions about the policy issues covered in each quiz, how confident they were in their knowledge, and what arguments they thought people would give for and against different issues. Study software unobtrusively tracked the amount of time participants spent with each quiz. To test how people responded to different online quiz types, this study compared participants’ reactions to three different presentations of numerical data and one control group who did not see any numerical data. Participants were randomly assigned to one of the four following experimental conditions:
- Slider Quizzes. In this condition, participants used three slider quizzes to answer questions on current public policy topics. Participants interacted with the quiz by moving a slider or entering a number into an open-ended box before hitting a “submit” button. If the answer entered was within three percentage points of the correct answer, the participant received a notice of their “Nice work!” and a description of the actual quantitative results. If the answer was outside of this range, the participant was presented with the correct answer.
- Multiple Choice Quizzes. This condition had participants respond to three closed-ended quizzes. Each quiz question had four answer options. Participants who answered correctly received a notice of their “Nice work!” while incorrect answers were corrected with the accurate information. This condition contained a format similar to those currently featured on most local news websites.
- Quiz Information. This condition provided study participants with the results of each of the quiz questions. There were no options in this condition for participants to interact.
- Control. In this condition, participants did not view any quizzes and did not receive any new information. This group was used as a point of comparison in determining which quiz format was most effective in helping people learn, increasing time on site, and engaging users.
Quiz Content
The study participants in three of the four conditions (Slider Quizzes, Multiple-Choice Quizzes, Quiz Information) answered questions and/or received information related to three current policy topics: health care, taxes, and the federal budget.
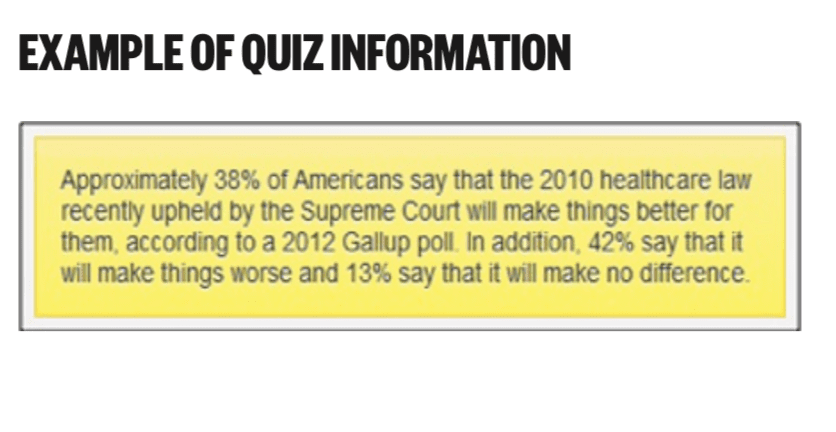
For health care, participants interacting with the Slider Quizzes and Multiple-Choice Quizzes were asked “What percentage of Americans say that the 2010 health care law recently upheld by the Supreme Court will make things better for them?” After answering, each participant then learned that “Approximately 38% of Americans say that the 2010 health care law recently upheld by the Supreme Court will make things better for them, according to a 2012 Gallup poll. In addition, 42% say that it will make things worse and 13% say that it will make no difference.”
For taxes, participants answered “What percentage of Americans approves of raising the income tax rate on incomes over $250,000 a year as a way to reduce the size of the national debt?” They then learned that “Approximately 66% of Americans approve of raising the income tax rate on incomes over $250,000 a year as a way to reduce the size of the national debt, according to a 2011 poll from the non-partisan Pew Research Center.”
For the federal budget, the quiz asked “What percentage of the estimated 2012 federal budget is spent on Social Security?” Participants learned that “Approximately 20% of the estimated 2012 federal budget is devoted to paying for Social Security, according to the federal Office of Management and Budget.”
People in the Quiz Information condition saw the quiz answers for each policy topic, but were not asked any of the questions.
Participant Demographics
There were no differences among the conditions with respect to these demographic attributes.
To gain a better understanding of the background characteristics of our sample, we also measured:
- Respondents’ political knowledge using nine quiz questions (e.g. which party has the most members in the Senate, what political position is now held by John Boehner, etc.) that could not be obtained from any of the experimental stimuli. Correct answers were summed to create a measure of knowledge. On average, respondents answered five of the nine questions correctly.
- How often respondents followed politics from hardly at all (1) to all of the time (4). On average, participants followed politics some of the time (average = 2.83).
- Respondents’ political ideology from very conservative (1) to very liberal (5) and partisanship from strong Democrat (1) to strong Republican (5). Average ideology was 2.90 and average partisanship was 3.19.
There were no differences among the conditions with respect to any of these political orientation variables.
FIELD TESTING
Based on the encouraging findings from the laboratory test, we wanted to test the quizzes in a more natural environment. We created code to experimentally test quizzes on news websites.
As different news sites cater to different audiences, it is important to enable news outlets to test how the quizzes work in their unique online environment. Our code allows news organizations to know how many people took part in a quiz on their site and whether the quiz affected time spent on their site.
Field Test #1
On December 11, 2012, a local television news station included an experimental quiz on their news site. The program randomly assigned respondents to either the multiple-choice or slider quiz. A link to the story containing the quiz, “Burglars are shopping for Christmas – in parking lots,” was featured on the station main webpage.
The quiz was embedded partway through the article, requiring some scrolling for visitors using a typical browser to view. In total, we logged 926 unique IP addresses visiting the page. A total of 369 unique IP addresses were randomly assigned to the multiple-choice quiz and 348 to the slider quiz. Site visitors with cookies disabled were shown a multiple-choice quiz and are not included in the analysis (n=209).
Field Test #2
On January 15, 2013, a local news station partnered with us to test the quizzes in a novel way: by including two quizzes on a single news page. As with the first field test, the quizzes randomly appeared as either a slider quiz or as a multiple-choice quiz. For this test, both quizzes could be slider quizzes, both could be multiple-choice quizzes, or one could be a slider quiz and the other a multiple-choice quiz.
The article was titled, “Starting at community college may not lower degree cost” and the quizzes asked about (a) what percentage of students at public, four-year institutions take out student loans and (b) the typical amount of student loan debt for those attending a four-year public college or university.
To view either of the quizzes, the site visitor with a typical browser needed to scroll down the page. The story was promoted on air and on the site main page. The web page attracted 454 visitors with unique IP addresses. As before, site visitors with cookies disabled were shown a multiple-choice quiz (n=92) and are not included in the results.
Overall, 19 percent were shown two multiple-choice quizzes, 20 percent were shown a multiple-choice quiz first and a slider quiz second, 30 percent saw a slider quiz first and a multiple-choice quiz second, and the remaining 31 percent saw two slider quizzes.
Field Test #3
Upon finding that combinations of quizzes on a single page increased time on site, we next explored whether a quiz consisting of seven questions about gun control would affect the amount of time respondents spent on a web page.
A single quiz was included on the web page, randomized to begin as either a slider or multiple-choice quiz. After receiving the correct information, respondents were able to complete up to six additional questions in a quiz format. Each quiz question was randomized to display as either a multiple-choice or a slider quiz.
On March 6, 2013, a local news station included the quiz on their website. As with the other quizzes, site visitors needed to scroll down part way through the article in order to see the quiz. The seven quiz questions probed (1) how many people have an active concealed handgun license, (2) how many people were denied a concealed handgun license, (3) what percentage of people convicted of a crime held a concealed handgun license, (4) how many firearms are manufactured in the United States, (5) the percentage of robberies that involve a firearm, (6) the percentage of Americans with a gun in their home, and (7) how many intentional deaths occur as a result of firearms. The design of the slider and multiple-choice quiz versions were identical to the previous studies.
There were 311 unique IP addresses recorded. Twelve percent of site visitors had cookies disabled and could not be randomly assigned. For the remaining visitors, 148 randomly first saw the multiple-choice quiz question and 126 first saw the slider quiz question.
SUGGESTED CITATION:
Stroud, Natalie Jomini, Scacco, Joshua, and Muddiman, Ashley. (2013, September). How online quizzes can benefit newsroom websites. Center for Media Engagement. https://mediaengagement. org/research/online-polls-and-quizzes
- Kent, M. L., Harrison, T. R., & Taylor, M. (2006). A critique of Internet polls as symbolic representation and pseudo-events. Communication Studies, 57, 299-315. Kim, S. T., Weaver, D., & Willnat, L. (2002). Media reporting and perceived credibility of online polls. Journalism & Mass Communication Quarterly, 77, 846-864. [↩]
- Wu & Weaver, 1997. [↩]
- Rosenberry, 2005; Schultz, 1999; Wu & Weaver, 1997. [↩]
- The difference among the Slider Quiz, Multiple-Choice Quiz, and Quiz Results conditions was significant (Kruskal Wallis Test χ2 (2) = 93.51, p < .01). A Mann-Whitney test of the difference between the slider and multiple-choice quiz formats was not significant (Mann-Whitney U = 5915, Z = 0.95, p = .34). The slider quiz yielded significantly more time than the quiz results (Mann-Whitney U = 2432, Z = 8.46, p < .01) as did the multiple-choice quiz (Mann-Whitney U = 2457, Z = 8.17, p < .01). [↩]
- The experimental condition was significant, F(3, 416) = 50.24, p < .01. Post-hoc tests showed that the Slider Quiz and Multiple-Choice Quiz conditions resulted in higher knowledge than the Quiz Results or Control conditions (p < .01). The Quiz Results condition also yielded greater knowledge than the Control condition (p < .01). The Slider Quiz and Multiple-Choice Quiz conditions did not significantly differ from each other (p = .99). [↩]
- Post-hoc comparisons for the Interaction show that the difference between the number of open-ended quiz questions answered correctly and the number of closed-ended quiz questions answered correctly differed for the Multiple-Choice (p < .05), Quiz Information (p < .01), and Control (p < .01) conditions, but not for the Slider Quizzes condition (p < .45). [↩]
- Enjoyment differed significantly across conditions, F(2, 310)=10.03, p < .01. Post-hoc comparisons revealed that participants rated Quiz Information as less enjoyable than Slider Quizzes (p < .01) and Multiple-Choice Quizzes (p < .01). The difference between Slider Quizzes and Multiple-Choice Quizzes is not significant (p < .60).[↩]
- Time spent on the page with the slider quiz (Mdn = 99 seconds, IQR = 100) was not significantly greater than time spent on the page containing the multiple-choice quiz (Mdn = 103 seconds, IQR = 104) (MannWhitney U = 63352.5, Z = 0.31, p = .76). [↩]
- The difference in participating in the quiz was not dependent on whether the first quiz was a slider or multiple-choice quiz (χ2(1)=.002, p=.97). [↩]
- Both Pearson’s correlations (Range = .30 to .66) and Spearman’s rho (Range = .56 to .63) for time on page and number of quiz questions completed were significant regardless of the strategy for handling outliers. [↩]
- The difference was significant, t(343) = 2.25, p < .05. [↩]
- The difference was significant, Mann-Whitney U = 13028, Z = 2.00, p < .05. Those seeing the same type of quiz question twice spent a median of 84 seconds on the page (IQR = 156). Those seeing two different types of quiz questions spent a median of 107 seconds on the page (IQR = 200) [↩]